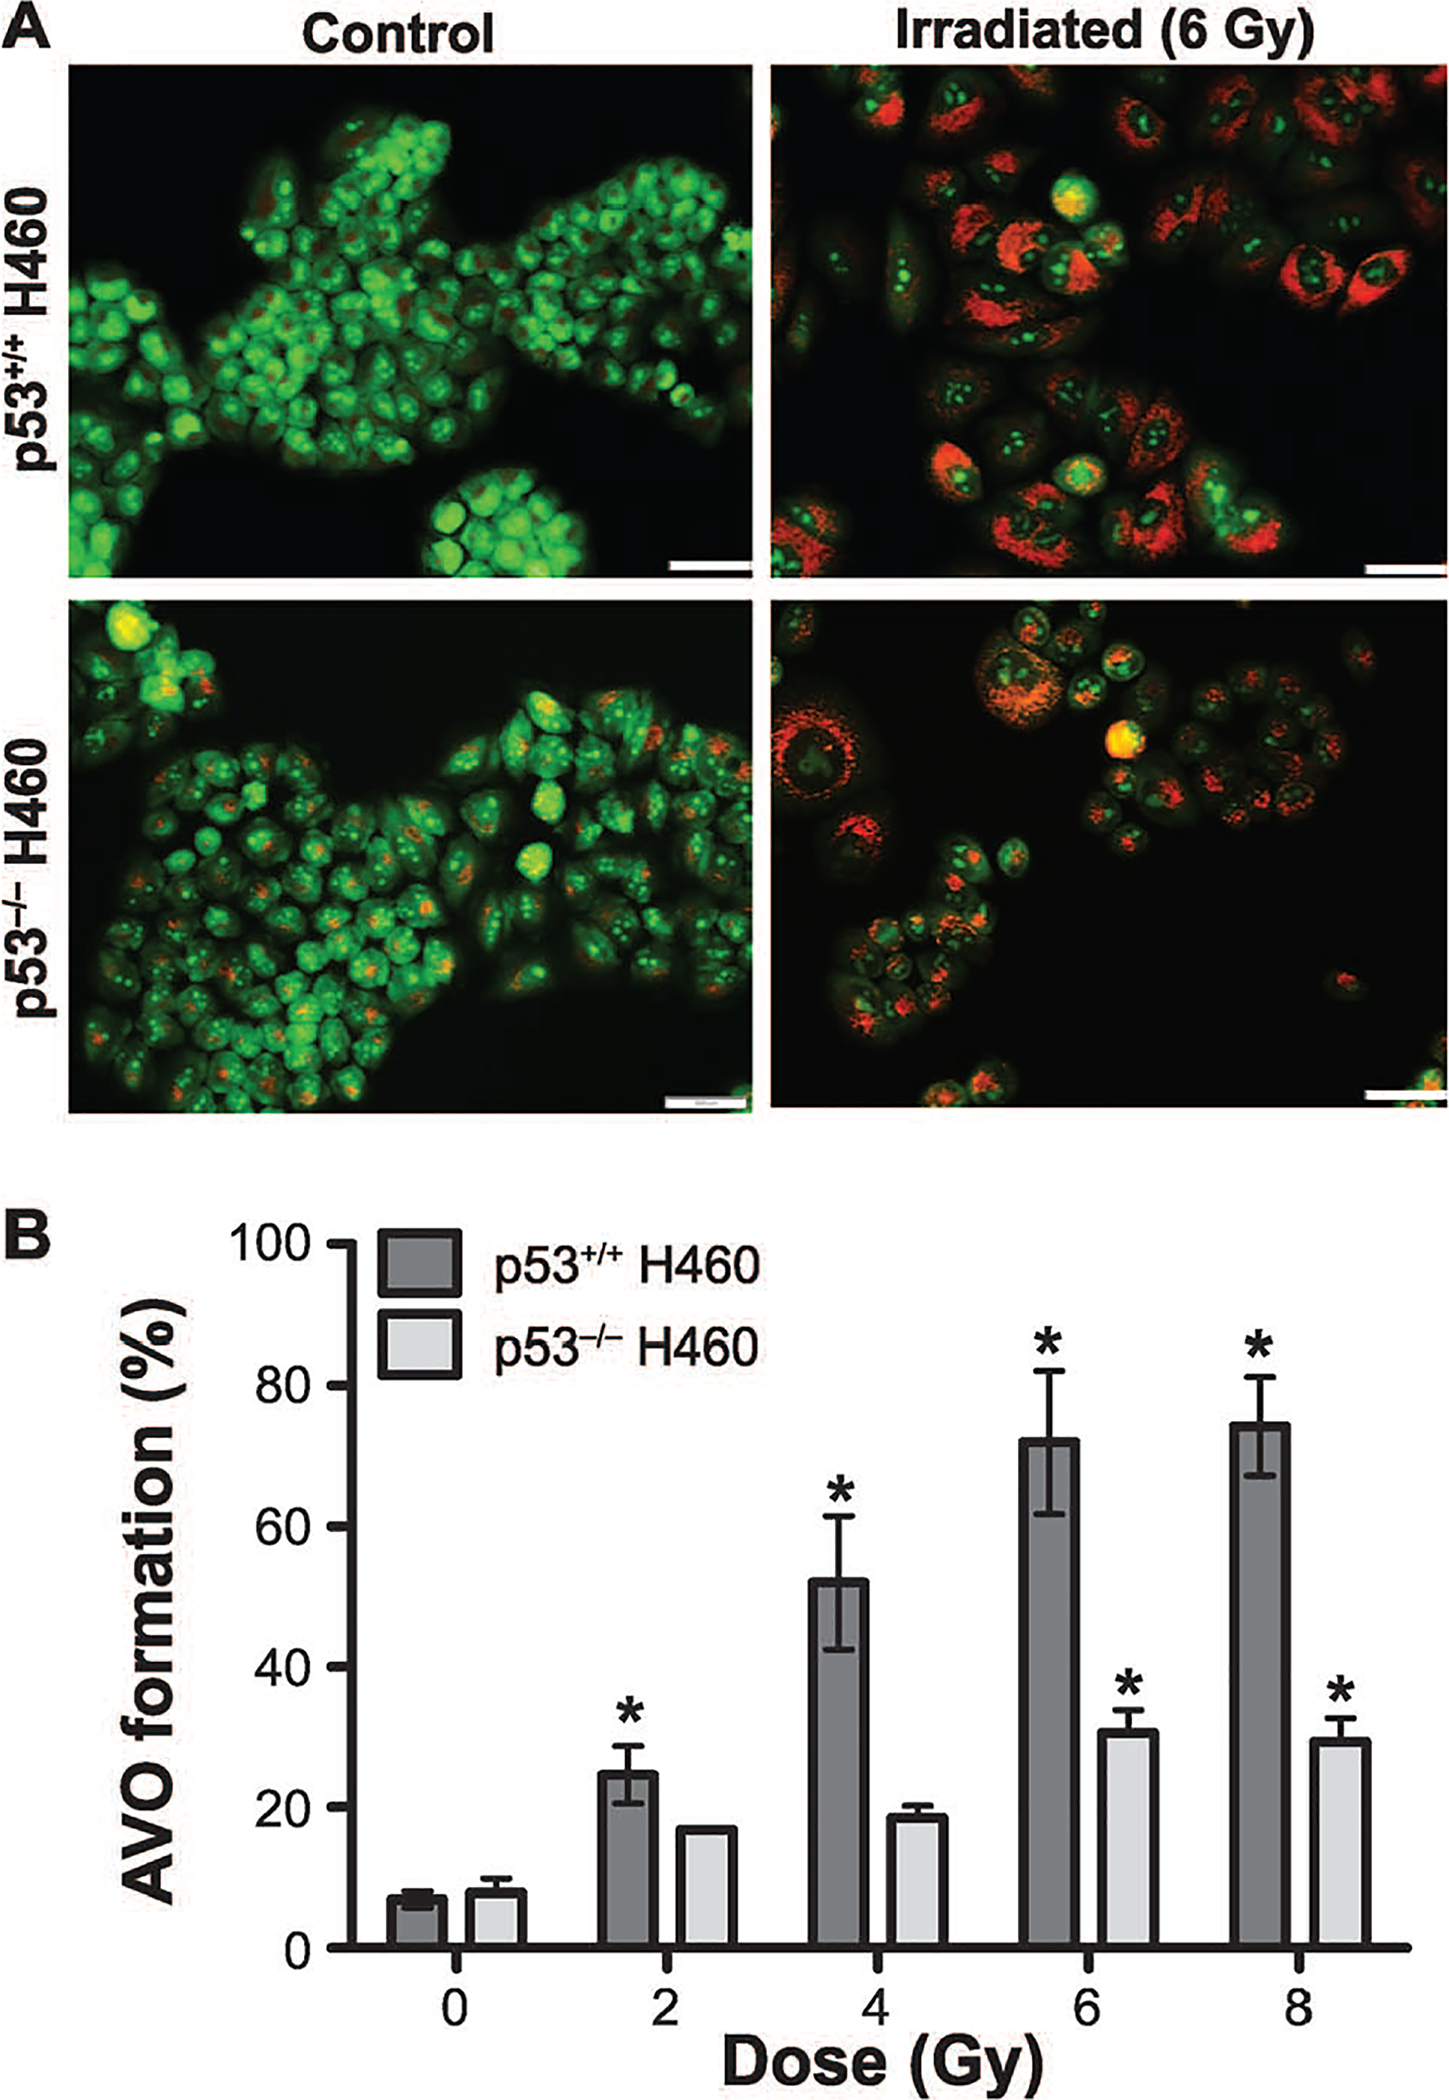
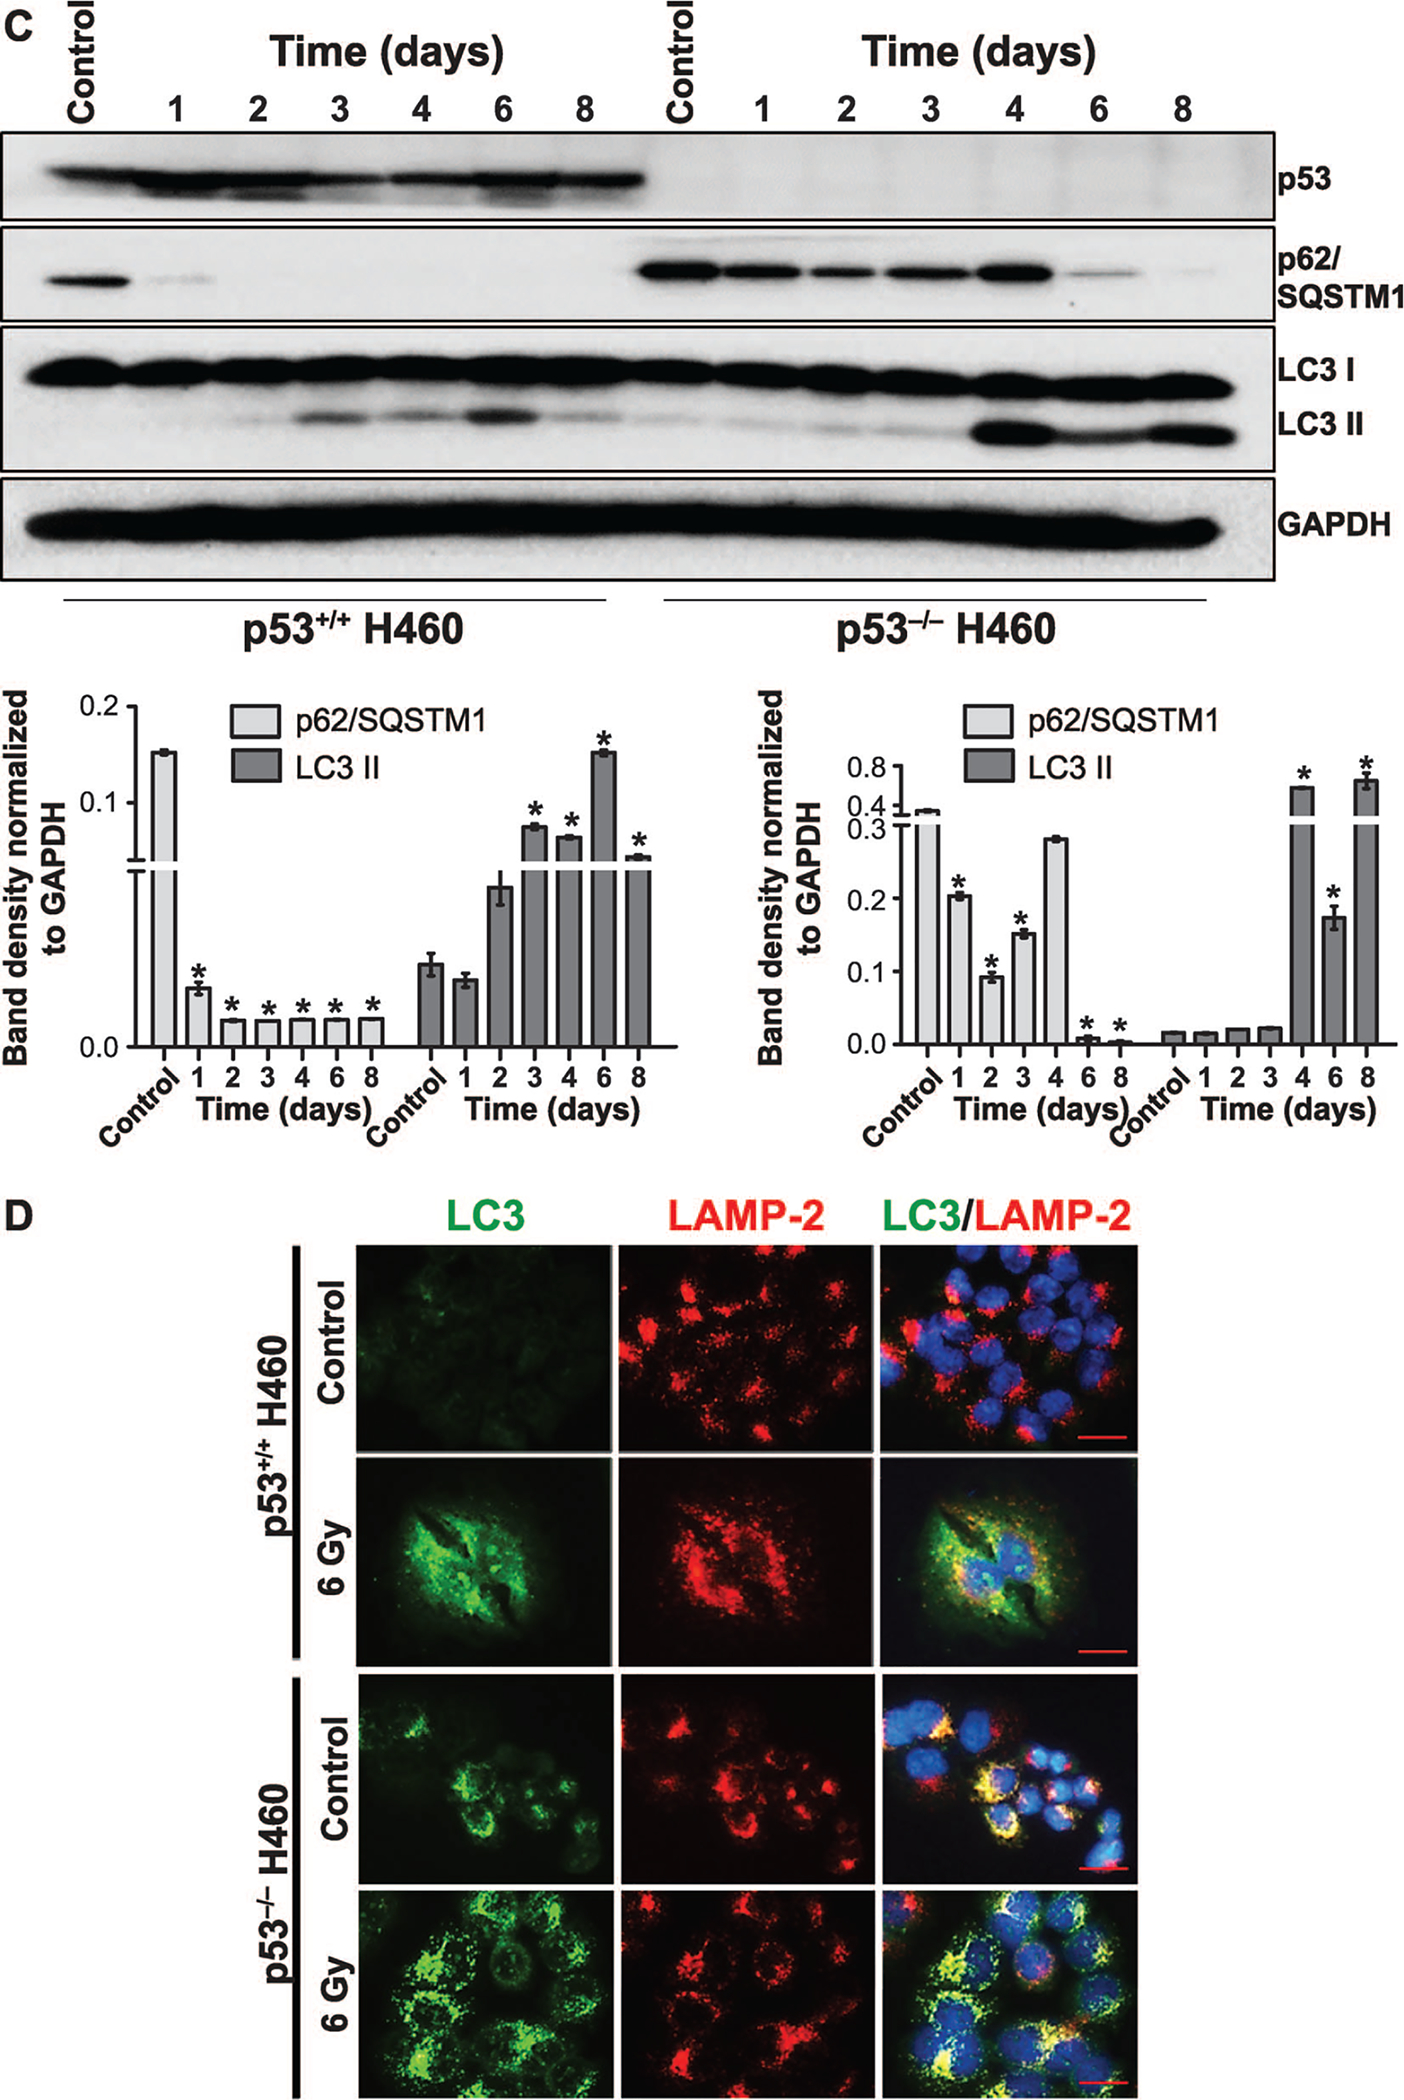
FIG. 2.


Radiation-induced autophagy in H460wt and H460crp53 cells. Panel A: Acridine orange staining. Three days after 6 Gy irradiation, cells were stained with acridine orange; images were taken at identical magnification (scale bar = 200 μm). Panel B: Quantification of acridine orange staining. Autophagy was quantified based on acridine orange staining as measured by flow cytometry. Panel C: Western blotting for levels of relevant proteins. The status of p53 in both H460 cell lines was confirmed by Western blotting. Autophagy was assessed based on p62/SQSTM1 degradation and the conversion of LC3 I to LC3 II. The bar graph in each panel indicates the relative band intensity generated from densitometric scans of three independent experiments in arbitrary densitometric units. Panel D: Co-localization of LC3 and LAMP. Fluorescence microscopy showing LC3 and LAMP2 co-localization in response to 6 Gy radiation. Imaging was performed 3 days after irradiation (scale bar = 20 μm, n = 2). Unless stated otherwise, data were from three independent experiments. *P < 0.05, control vs. irradiated cells.
