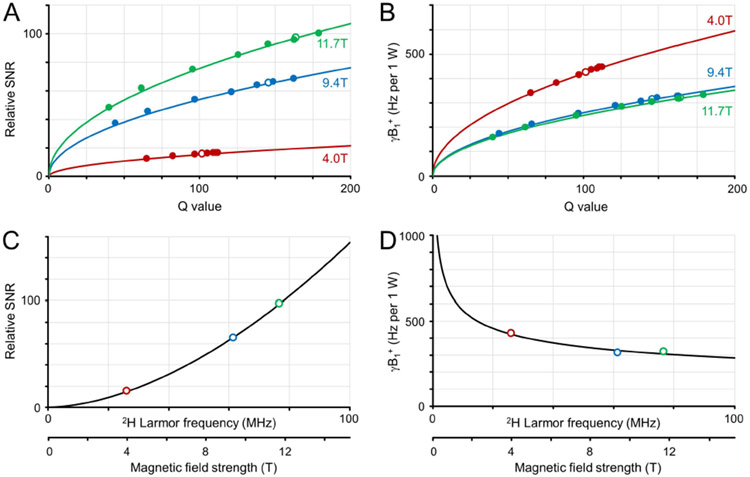
Figure 2:
Deuterium sensitivity and transmit efficiency on phantoms in vitro. (A) Relative SNR and (B) transmit field amplitude per 1 W input power as a function of RF coil Q value for a range of coil loads at 4 T (red), 9.4 T (green), 11. T (blue). The solid dots represent experimental data, whereas the solid line represents the best fit according to CQ1/2. The open dots represent the values for RF coil Q with a post mortem rat brain load. (C, D) Magnetic field dependence of (C) relative SNR and (D) transmit efficiency for rat brain postmortem. The solid (R3.10) lines represent the best fit according to CB0n.

