
Figure 5.
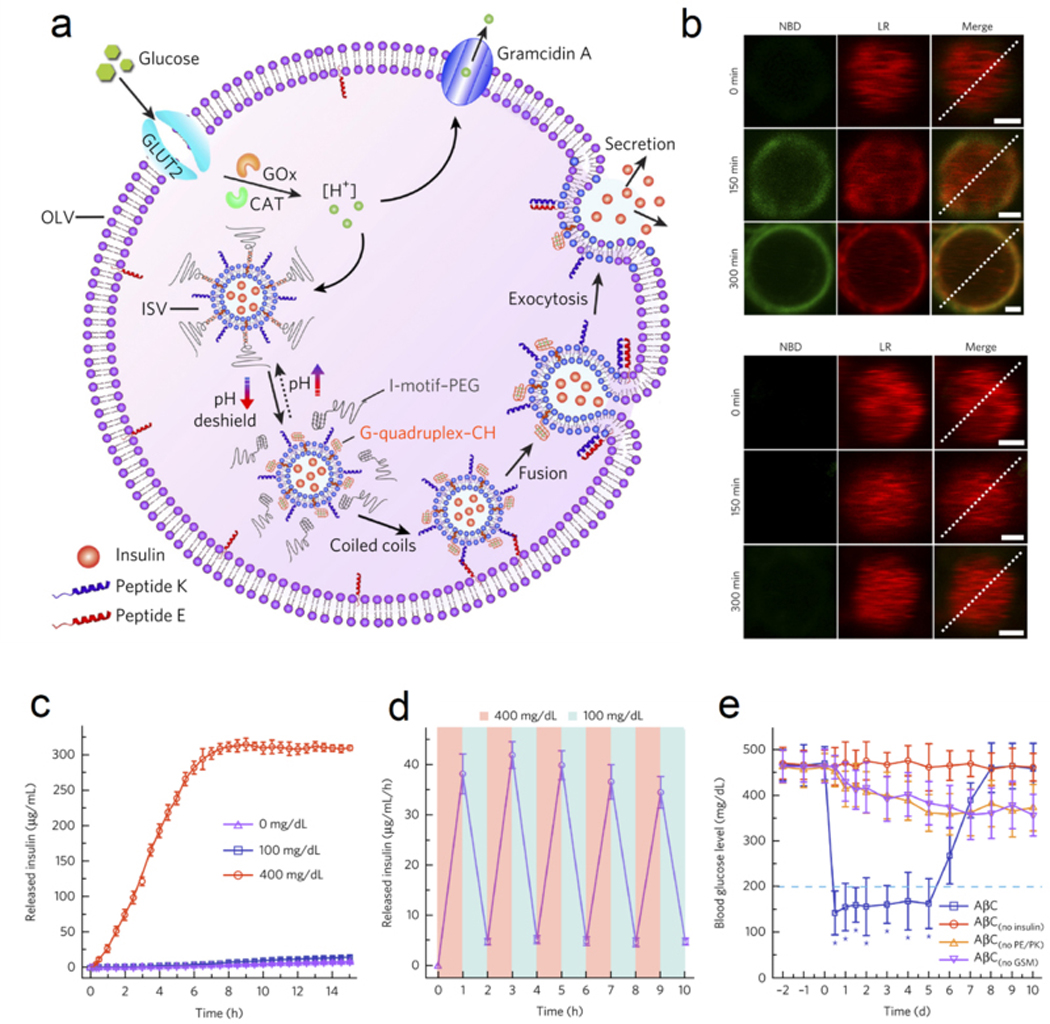
The design of membrane-fusion-mediated glucose responsive insulin release. (a) Schematic of the biochemical procedure of AβCs for glucose-triggered insulin release. (b) Upper, high glucose concentration (400 mg/mL) triggered membrane fusion; Lower, low glucose (100 mg/mL) failed to trigger membrane fusion. (c) Glucose-responsive insulin release from AβCs. Data were presented as mean ± SD (n=3). (d) Pulsatile insulin release by switching glucose concentration between 100 and 400 mg/dL. Data were presented as mean ± SD (n=3). (e) The glucose regulation ability of AβCs in type 1 diabetic mice. Data were presented as mean ± SD (n=5). *P < 0.001. Reproduced with permission.[8d] Copyright 2017, Springer Nature.