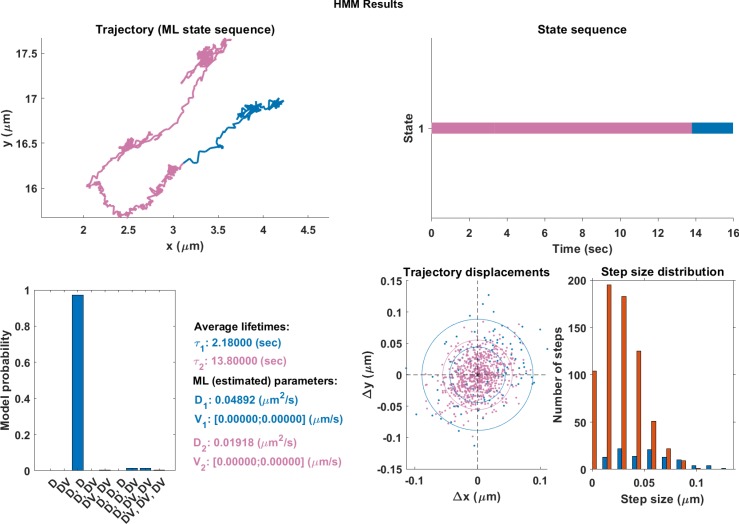
Appendix 1—figure 1. The same single trajectory as in Figure 3 but processed using the HMM-Bayes package described in Monnier et al. (2015).
The plot shows: the original trajectory (top left); the inferred state sequence of the most likely model (top right); the model probabilities given a maximum of three possible states (bottom left); the average lifetime of each state and estimated parameters of the most likely model (bottom center left), which in this case is two different diffusive states; individual increment displacements (bottom center right); and the step size distribution of those increments classed into the two different states.

