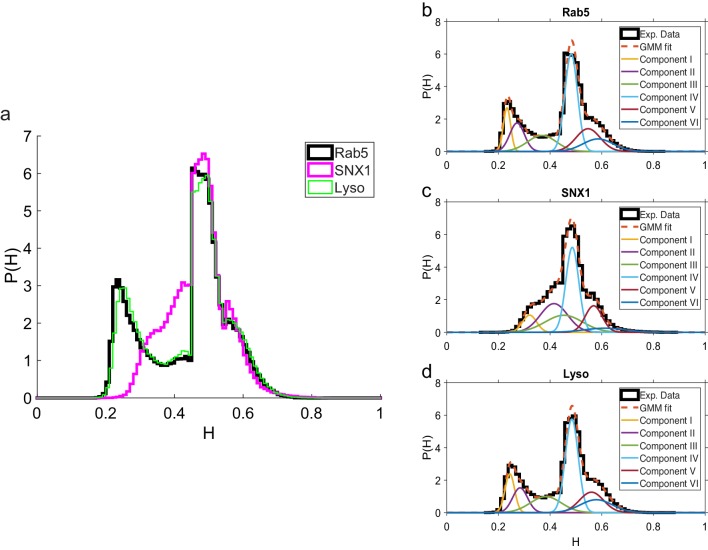
Figure 5. Comparison of Hurst exponent distributions for GFP-Rab5, GFP-SNX1 and lysosomes.
(a) Histograms of Hurst exponents for GFP-Rab5 (black), GFP-SNX1 (magenta) endosomes and lysosomes (green) plot on the same axes for comparison. The individual histograms of Hurst exponents (black solid) for GFP-Rab5-tagged endosomes, GFP-SNX1-tagged endosomes and lysosomes are shown in (b, c and d) respectively. For each histogram, the Gaussian mixture model fit for six components (red dashed) and individual Gaussian distribution components are shown on the same plot. The number of components were chosen through the Bayes information criterion shown in Appendix 4—figure 1.

