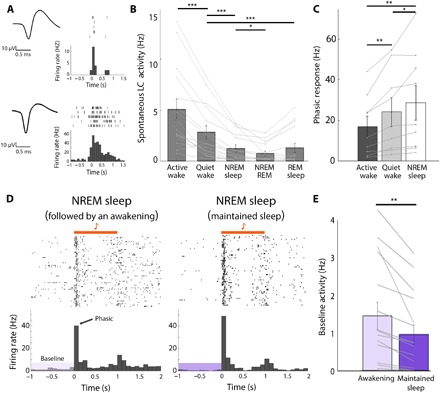
Fig. 2. Baseline tonic LC activity is higher before SEAs from NREM sleep.

(A) Two representative LC clusters recorded during the experiment. Left: Action potential waveforms of unit clusters. Right: Corresponding raster plot and peristimulus time histogram (PSTH) in response to toe pinch under light anesthesia. (B) Average spontaneous firing rates of LC clusters (n = 16 from three rats) across different sleep-wake states, one-way RM ANOVA followed by post hoc FDR-corrected t test (***P < 0.001 and *P < 0.05). (C) Phasic LC response to sound (0 to 100 ms after sound onset) in 9 of 16 LC neurons exhibiting auditory-evoked discharges as a function of vigilance state. Mean ± SEM across n = 9 clusters, one-way RM ANOVA followed by post hoc FDR-corrected t-test; *P < 0.05 and **P < 0.01. (D) Representative auditory-evoked multiunit (MU) firing (raster and PSTH) during NREM sleep. Left: Trials followed by awakening. Right: Trials followed by maintained sleep. Horizontal orange bar shows 1-s tone stimulus. (E) Quantification of baseline LC activity during NREM sleep in trials preceding awakening (light purple) versus maintained sleep (dark purple). Data represent means ± SEM (**P < 0.01, paired t test; n = 16 neuronal clusters, an average of 84 trials per cluster, n = 3 rats). Note significantly higher baseline activity before awakenings (51.37% increase compared with maintained sleep).
