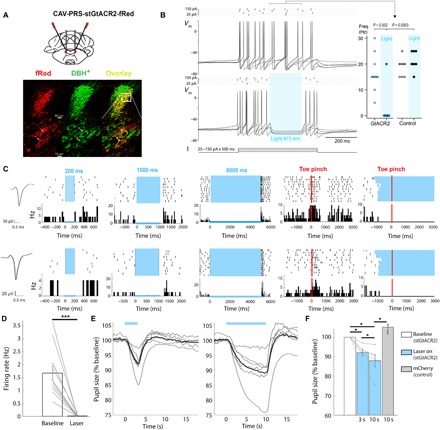
Fig. 5. Specific and effective optogenetic inhibition of LC neurons.

(A) Schematic of bilateral LC injection and optic fiber implantation (top) and specific expression of stGtACR2-fRed in LC neurons (bottom): representative coronal images showing CAV2-PRS-stGtACR2-fRed expression (left column, red), labeling of DBH+ neurons (middle column, green), and their overlay (right column, yellow). (B) Whole-cell current-clamp recording from LC neurons in pontine slice (n = 10 rats, one to three neurons per rat) showing the spike discharge evoked by current injection is prevented by a brief pulse of light (473 nm, 200 ms x 4 mW) to activate the stGtACR2, a silencing effect seen across recordings from transduced LC neurons (data from response to 175-pA pulse; P = 0.002, Wilcoxon matched pairs; n = 10 neurons), whereas no effect of light was seen in nontransduced LC neurons in the same slices (n = 7 neurons). (C) Representative data from two recordings of neuronal clusters in the same CAV2-PRS-stGtACR2-fRed transduced rat. (Left) Action potential waveforms, (middle) raster plots and PSTH of inhibitory responses to different laser durations (in blue, 200, 1000, and 5000 ms), and (right) LC neuron with typical biphasic response to contralateral toe pinch, abolished by concurrent illumination. (D) Bar graph shows significant decrease in the firing rate of LC neurons upon 1 s of laser illumination (n = 13 units from two rats; nine trials, on average, per unit; ***P < 0.001, paired t test). (E) Representative pupil size traces (gray lines represent single trials, and black lines represent average of the trials) during 3 s (left) and 10 s (right) of laser illumination. (F) Bar graph shows significant pupil constriction when LC was silenced in a duration-dependent manner (stGtACR2 in blue, n = 6 rats; control mCherry in gray, n = 5 rats, 5 to 15 trials per laser duration condition), *P < 0.05, Wilcoxon test.
