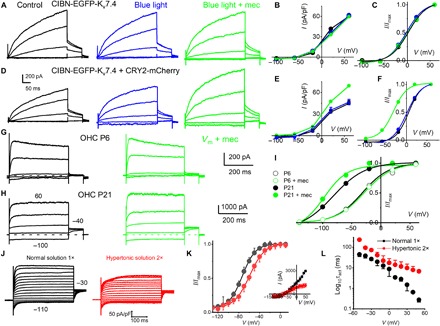
Fig. 5. CIBN-EGFP-Kv7.4 oligomerization and Kv7.4 consolidation in OHCs and mechanical sensitivity.

(A) HEK 293 cells transfected with CIBN-EGFP-Kv7.4 for 48 hours. Outward CIBN-EGFP-Kv7.4 current traces (black) recorded from −60-mV holding potential, stepped from −100 to 50 mV, ΔV = 30 mV. Current traces after exposure to blue light for ~5 min (blue traces) and blue light + mechanical (mec) (0.6 μm) cell-body displacement (green traces). (B) Current density (in pA/pF), voltage relations of summary data from seven cells, are shown. (C) The tail current at −40 mV and the V1/2 (mV) and 1/k (V−1) for activation curves: control, 0.6 ± 3.2 and 21.3 ± 3.5; after blue light, −2.6 ± 3.4 and 51.7 ± 6.1; and blue light + mec displacement, 5.5 ± 3.5 and 64.1 ± 4.4 (n = 7). Comparing V1/2, there was significant difference at the P < 0.05 level for the population means F(2,18) = 10, P = 0.001. Post hoc comparisons test for control and blue light (P = 0.2). Blue light + mec displacement versus control means were significantly different (P = 0.04). Blue light + mec displacement versus blue-light means were significantly different (P = 0.001). Comparing 1/k at the P < 0.05 level for the population means F(2,18) = 148, P = 0.0001. Post hoc comparisons using the Tukey HSD test indicated that all three condition means were significantly different (P = 0.0001). (D to F) Results similar to that described in (A) to (C); HEK 293 cells were cotransfected with CIBN-EGFP-Kv7.4 and CRY2-mCherry. (D) τact abbreviated by ~2-fold after 5-min blue-light exposure (at 60 mV), and current density increased after 0.6-μm displacement (~1.3-fold). The tail current at −40 mV, and the V1/2 (mV) and 1/k (V−1) for activation curves were as follows: control, 0.6 ± 1.4 and 55.5 ± 10.8; after blue light, −4.5 ± 3.2 and 52.0 ± 9.7; and blue light + mec displacement, −32.6 ± 2.7 and 60.3 ± 8.1 (n = 5). Comparing V1/2 at the P < 0.05 level for the population means F(2,12) = 250, P = 0.0001. Post hoc comparisons using the Tukey HSD for three conditions (P = 0.2). (G) Family of IKn traces (black) recorded from an OHC located at the 2-kHz frequency-place map of P6 mouse cochlea and after displacement of the basolateral cell wall by ~0.4 μm (green). Currents elicited from a holding voltage of −60 mV and the voltage steps from −130 to 50 mV, ΔV = 40 mV. (H) Similar recording as in (G) from P21 OHC. A displacement of 0.4 μm sped up the τact [at a 60-mV step, τact (ms) was 7.6 ± 4.9 and 0.9 ± 0.5 (n = 5, P < 0.05)] before and after mec displacement, respectively. (I) At P21, mec displacement produced a leftward shift in the steady-state activation properties. The tail current at −40 mV and the V1/2 (mV) and 1/k (V−1) for activation curves were as follows: control, −81.8 ± 0.9 and 36.6 ± 7.7, and mec displacement, −97.3 ± 2.8 and 60.6 ± 12.4 (n = 5). Comparing V1/2 (P < 0.0001) and 1/k (P = 0.006). Thus, 0.4-μm mec displacement produced a ~15 leftward shift in the voltage dependence and ~8-fold change in the τact in IKn. (J) IKn traces (black) from −60-mV holding voltage and voltage steps from −110 to 50 mV from P24 OHCs. In red traces are recordings from the same OHC ~5 min after bath perfusion of 630 mosmol (mannitol-based) solution. The current magnitude plummeted in five of seven OHCs. For the remaining two OHCs, the current magnitude was unchanged after hypertonic solution. (K) The summary data from five OHCs are shown as inset in the current-voltage relationship. V1/2 for IKn in P24 OHC was −73.2 ± 3.3 mV; the voltage sensitivity at half-activation, 1/k, was 79.4 ± 9.3 V−1 (n = 5); posthypertonic solution (2×) was −59.3 ± 3.7 mV and 1/k was 68.5 ± 8.8 V−1 (n = 5). Comparing V1/2 (P = 0.0002) and 1/k (P = 0.09). (L) Changes in the τact relative to step voltages for IKn in normal and hypertonic solution (n = 5 OHCs).
