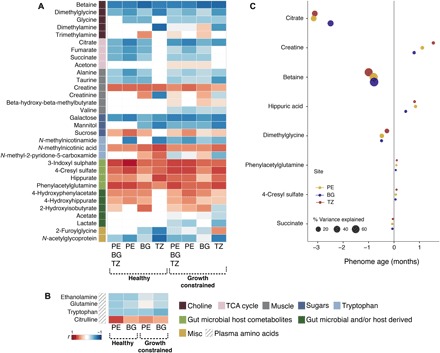
Fig. 1. Biochemical variation associated with aging.

(A) urinary and (B) plasma metabolic profiles of infants from Peru (PE), Bangladesh (BG), and Tanzania (TZ). The heat map presents the correlation coefficient (r) obtained from PLS models: Blue colors indicate a negative association with age, and reds represent metabolic shifts positively associated with infant aging. (C) Mean effect size of age-discriminatory urinary metabolites on the PA based on children with healthy growth trajectories. The effect size is depicted as the estimated change in PA for each SD change in a metabolite concentration. Color indicates cohort site, and the size of the symbols indicates the percentage PA variance explained.
