


Fig. 2. Time-dependent variation in the eight urinary metabolites used to calculate the PA of the study children.
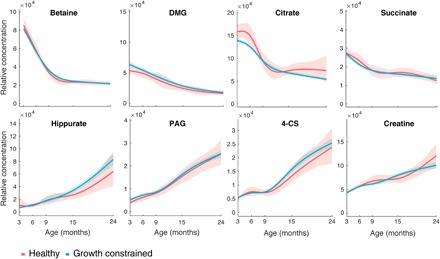
Relative concentrations of metabolites were obtained by measuring the area under selected spectral regions corresponding to betaine, DMG, citrate, succinate, hippurate, PAG, 4-CS, and creatine. Shaded area represents 95% CI.