
Fig. 3. PAZ of growth-constrained and healthy infants relative to their chronological age across the three sites.
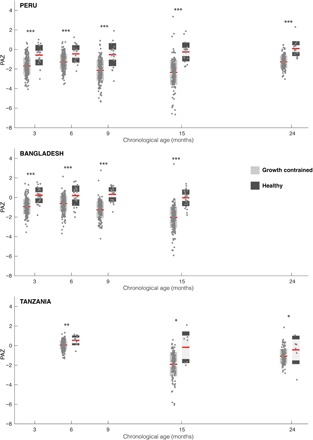
The PAZ score of healthy and growth-constrained infants from each site was calculated from eight age-discriminatory urinary metabolites. Significant differences were observed between healthy and growth-constrained children at all sampling points in all cohorts. Mann-Whitney U test, *P < 0.01, **P < 0.001, and ***P < 0.0001 (Healthy Peru: N3 months = 21, N6 months = 19, N9 months = 20, N15 months = 20, N24 months = 18; Growth constrained Peru: N3 months = 220, N6 months = 214, N9 months = 197, N15 months = 183, N24 months = 141; Healthy Bangladesh: N3 months = 25, N6 months = 27, N9 months = 24, N15 months = 26; Growth constrained Bangladesh: N3 months = 196, N6 months = 197, N9 months = 181, N15 months = 184; Healthy Tanzania: N6 months = 11, N15 months = 7, N24 months = 7; Growth constrained Tanzania: N6 months = 209, N15 months = 129, N24 months = 122).