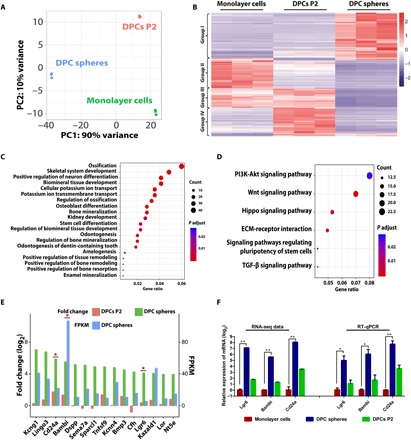
Fig. 3. Transcriptome analysis identified the enriched genes in DPC spheres.

(A) Principal components (PC) analysis of DPC spheres indicated that these cells were significantly different from monolayer cells and DPCs P2. (B) Heat map of the differentially expressed genes in DPC spheres. RNA sequencing (RNA-seq) analysis of DPC spheres, monolayer cells, and DPCs P2 identified significantly differentially expressed genes in these populations. Cutoff line: Fold change > 2 and adjusted P value of <0.01. (C) GO analysis indicated a significant enrichment of ossification associated genes in DPC spheres. Top 20 significantly enriched GO biological processes in DPC spheres were shown. (D) Signaling pathway analysis indicated that top 2 significantly enriched signaling pathway were Wnt and phosphatidylinositol 3-kinase (PI3K) pathway in DPC spheres. TGF-β, transforming growth factor–β. (E) A group of surface markers were identified to be enriched in DPC spheres. Top 15 candidate surface markers were listed by comparing differential gene expression profile between DPC spheres and monolayer cells and overlapping with surface protein database (fold change ≥ 2). Candidates chosen for further validation were labeled with a star. FPKM, fragments per kilobase million. (F) Confirmation of surface marker candidate genes by RT-qPCR. RT-qPCR analysis was performed for selected candidate marker genes enriched in DPC spheres, including Lgr6, Bambi, and Cd24a. Error bar represents triplicate independent samples. *P < 0.05 and **P < 0.01 (Student’s t test). GAPDH was used as the house keeping control.
