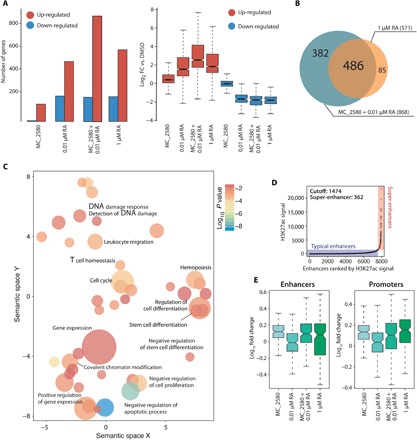
Fig. 2. LSD1 plays a key role in the control of differentiation of APL cells.

(A) RNA sequencing (RNA-seq) was performed in NB4 cells treated with MC_2580 and/or RA (0.01 and 1 μM) for 24 hours and DMSO as control. Left: The bar plot represents number of genes regulated [up- or down-regulated with respect to control; RPKM (reads per kilobase million) > 0.5; log2(FC) > 1.5] upon the indicated treatments. Right: The box plot shows magnitude of induction by the indicated treatment versus control (DMSO). (B) Venn diagrams indicating the sum of all regulated genes, number of genes regulated by each individual treatment, and number of genes regulated by both treatments in NB4 cells treated with MC_2580 and 0.01 μM RA versus 1 μM RA. (C) Gene Ontology (biological processes) analysis of LSD1 target genes in NB4 cells. Adjusted P values and relative enrichment (color coded) are shown for each class. (D) Scatter plots of super-enhancers in cells treated with MC_2580 + 0.01 μM RA. All stitched regions were ranked by H3K27ac signal. Super-enhancers and typical enhancers were in different colors as indicated. (E) Box plot analysis of H3K4me2 enrichment upon indicated treatment at enhancers (left) and promoters (right) of the 382 genes shown in Fig. 3B. Values are represented as log10FC versus DMSO.
