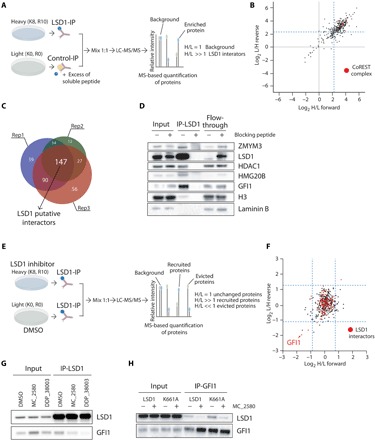
Fig. 4. Pharmacological inhibition of LSD1 disrupts its interaction with GFI1.

(A) Schematic representation of SILAC mass spectrometry approach to identify LSD1 interactors in NB4 cells. LC-MS/MS, liquid chromatography–tandem mass spectrometry. (B) Scatterplot showing log2 (heavy/light) ratio of forward reaction on the x axis (Rep1) and the log2 (light/heavy) ratio of reverse reaction on the y axis (Rep3). In the top right quadrant are represented LSD1 interactors. The blue dashed lines define the threshold used to define the LSD1 interactors from the background. Proteins belonging to the CoREST complex are shown in red dots. (C) Venn diagrams with numbers of individual and overlapping putative LSD1 interactors identified in the three different SILAC replicates. (D) Western blot analysis of LSD1 and some identified interactors in LSD1 IPs, with or without blocking peptide. Lamin B1 is used as loading control. (E) Schematic representation of SILAC mass spectrometry approach to identify recruited and evicted interactors of LSD1, upon LSD1 pharmacological inhibition with 2 μM MC_2580 for 24 hours. (F) Scatterplot showing log2 (heavy/light) ratio of forward reaction on the x axis and the log2 (light/heavy) ratio of reverse reaction on the y axis. Proteins recruited by LSD1 after inhibition are present in the top right quadrant, while proteins evicted from the interaction with LSD1 after drug treatment are found in the bottom left quadrant. Proteins previously identified as interactors of LSD1 in NB4 are shown as red dots. The blue dashed lines define the threshold used to determine recruited and evicted proteins. (G) Western blot analysis of LSD1 and GFI1 in LSD1 IPs in NB4 cells treated for 24 hours with DMSO, 2 μM MC_2580, or 2 μM DDP_38003. (H) Western blot analysis of LSD1 and GFI1 in GFI1 IPs in NB4 LSD1 KO cells transduced with empty vector, wild-type, or catalytic inactive K661A-LSD1, treated with 2 μM MC_2580 or DMSO.
