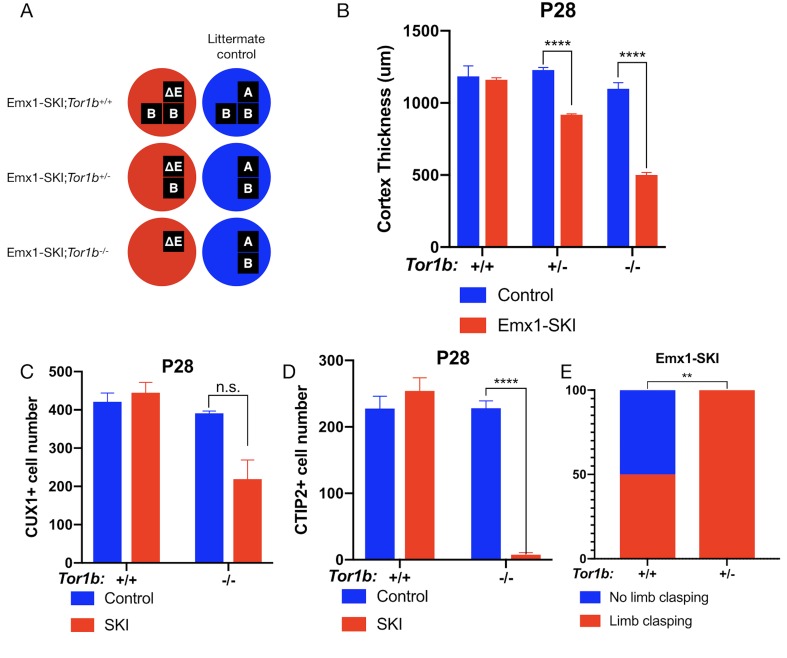
Figure 2. TorsinB dose-dependently worsens a DYT1 model.
(A) Illustration of examined genotypes. Each row of boxes within the circles denote the presence or absence of Tor1a (top row) or Tor1b (bottom row) alleles following Cre recombination. The presence of a letter (‘A’ ‘ΔE’ or ‘B’) indicates an intact allele, whereas the absence of a letter indicates a deleted allele. (B) Cortical thickness of P28 Emx1-SKI;Tor1b+/+, Emx1-SKI;Tor1b+/-, and Emx1-SKI;Tor1b-/- mice. TorsinB loss reduces cortical thickness in Emx1-SKI mice in a dose-dependent manner (2% reduction in Emx1-SKI;Tor1b+/+, 25.2% reduction in Emx1-SKI;Tor1b+/-, and 54.5% decrease in Emx1-SKI;Tor1b-/-; two way ANOVA main effect of background genotype F1,13 = 128.3, p<0.0001, age F2,13 = 62.65, p<0.0001, and interaction F2,13 = 36.98, p<0.0001; Sidak’s multiple comparisons test p=0.9323 for Tor1b+/+, p<0.0001 for Tor1b+/-, p<0.0001 for Tor1b-/-; Tor1b+/+ control n = 3; Emx1-SKI n = 5, Tor1b+/- control n=3, Emx1-SKI n = 3, Tor1b-/- control n=2, Emx1-SKI n = 3). (C) CUX1+ cell counts in sensorimotor cortex of P28 Emx1-SKI;Tor1b+/+ and Emx1-SKI;Tor1b-/- mice. There is no significant reduction in the number of CUX1+ cells in Emx1-SKI;Tor1b+/+ sensorimotor cortex (unpaired t-test t16 = 0.8469, p=0.4095; control n = 3, SKI n = 5). Simultaneous deletion of two torsinB alleles reduces CUX1+ cell counts by 44.0% (unpaired t-test t3 = 2.655, p=0.0766; control n = 2, SKI n = 3) though this reduction does not reach statistical significance. (D) CTIP2+ cell counts in sensorimotor cortex of P28 Emx1-SKI;Tor1b+/+ and Emx1-SKI;Tor1b-/- mice. CTIP2+ neuronal cell counts are not reduced in Emx1-SKI;Tor1b+/+ mice (unpaired t-test t6 = 0.8844, p=0.4105; control n = 3, SKI n = 5). CTIP2+ cell counts in Emx1-SKI;Tor1b-/- are significantly reduced by 96.6% (unpaired t-test t3 = 24.44, p<0.0001; control n = 2, SKI n = 3). (E) Proportion of Emx1-SKI;Tor1b+/+ and Emx1-SKI;Tor1b+/- mice exhibiting limb clasping during tail suspension. A significantly greater proportion of Emx1-SKI;Tor1b+/- mice exhibit limb clasping during tail suspension compared to Emx1-SKI;Tor1b+/+ (Chi square test χ2 = 7.441, p=0.0064; Emx1-SKI;Tor1b+/+n = 12, Emx1-SKI;Tor1b+/- n = 11).


