Fig. 1.

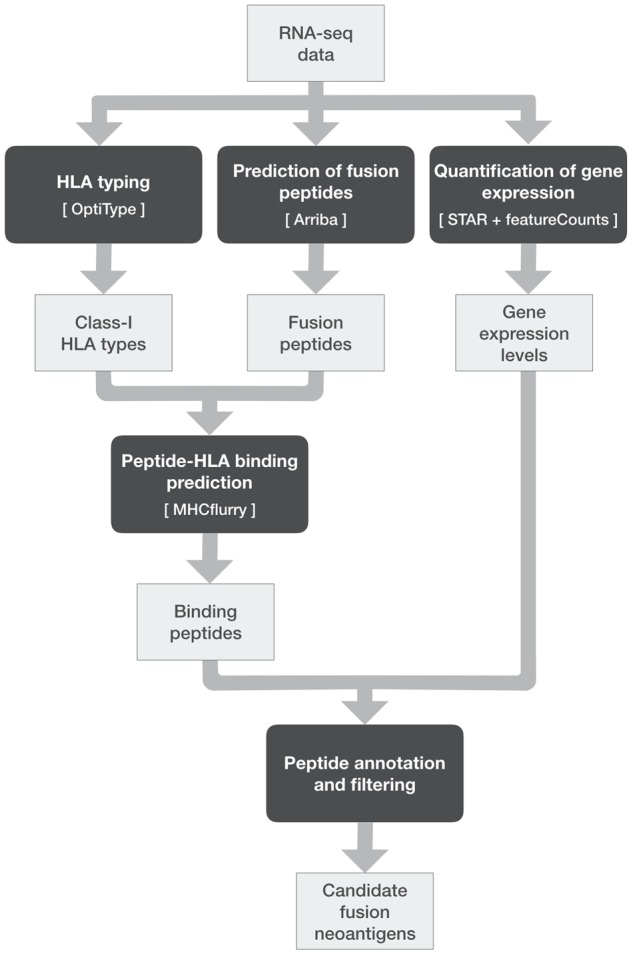
Schematization of the NeoFuse pipeline: computational modules represented as dark-grey boxes (with tool names in square brackets) and output files as light-grey boxes

Schematization of the NeoFuse pipeline: computational modules represented as dark-grey boxes (with tool names in square brackets) and output files as light-grey boxes