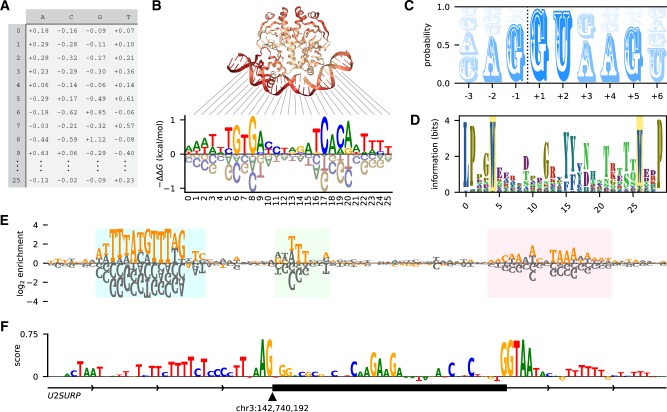
Fig. 1.
Logomaker logos can represent diverse types of data. (A) Example input to Logomaker. Shown is an energy matrix for the transcription factor CRP; the elements of this pandas DataFrame represent - ΔΔG values contributed by each possible base (columns) at each nucleotide position (rows). Data are from Kinney et al. (2010). (B) An energy logo for CRP created by passing the DataFrame in panel A to Logomaker. The structural context of each nucleotide position is indicated [PDB 1CGP (Parkinson et al., 1996)]. (C) A probability logo computed from all annotated 5 splices sites in the human genome (Frankish et al., 2019). The dashed line indicates the exon/intron boundary. (D) An information logo computed from a multiple alignment of WW domain sequences [PFAM RP15 (Finn et al., 2014)], with the eponymous positions of this domain highlighted. (E) An enrichment logo representing the effects of mutations within the ARS1 replication origin of S.cerevisiae. Orange characters indicate the ARS1 wild-type sequence; highlighted regions correspond (from left to right) to the A, B1 and B2 elements of this sequence (Rao and Stillman, 1995). Data (unpublished; collected by J.B.K.) are from a mutARS-seq experiment analogous to the one reported by Liachko et al. (2013). (F) A masked logo (Shrikumar et al., 2017) representing the importance scores of nucleotides in the vicinity of U2SURP exon 9, as predicted by a deep neural network model of splice site selection. Logo adapted (with permission) from Fig. 1D of Jaganathan et al. (2019). The script used to make this figure is posted on the Logomaker GitHub page at logomaker/examples/figure.ipynb

