
Fig. 3.
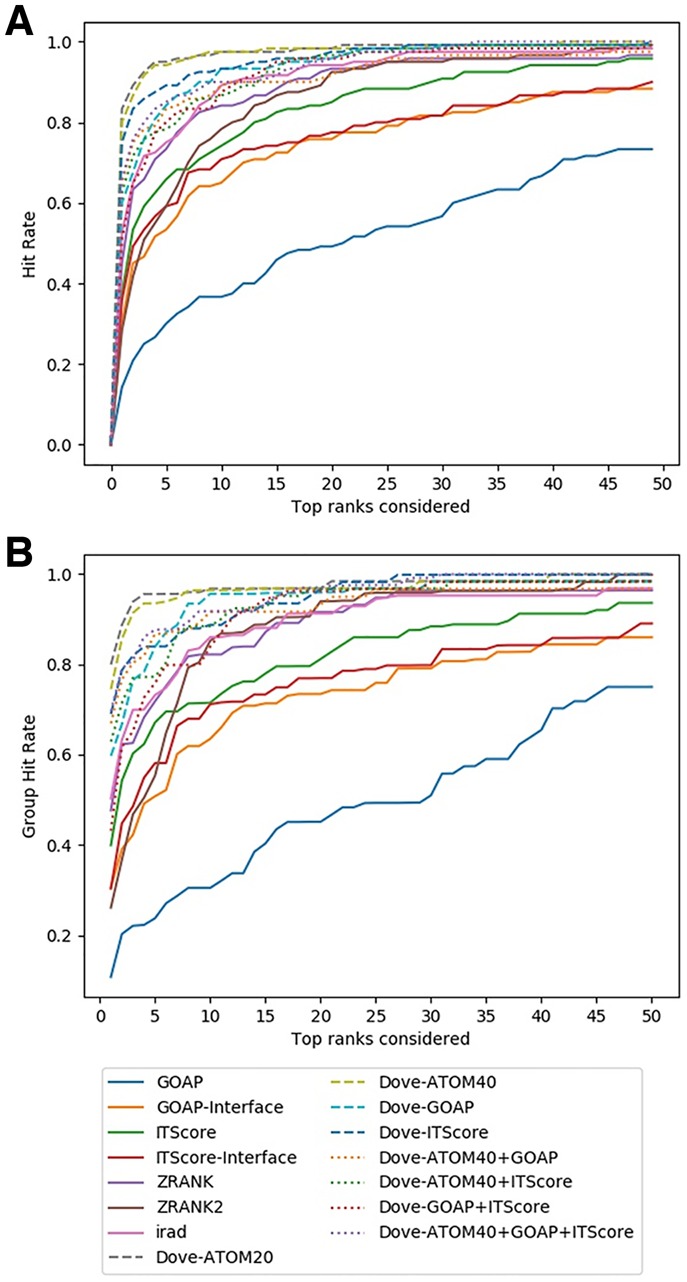
Comparison on the ZDOCK Benchmark dataset. (A) The fraction complexes among the 120 complexes in the benchmark set for which each method selected at least 1 acceptable model (within top x scored models) was shown. Results shown are from test sets. In addition to DOVE with eight different feature combinations, performance of GOAP, GOAP-Interface, ITScore, ITScore-Interface, ZRANK, ZRANK2 and IRAD are shown. (B) Considering the similar complexes that were grouped into 63 groups (Supplementary Table S1), the hit rates for complexes in each group were averaged and re-averaged over the 63 groups for each x