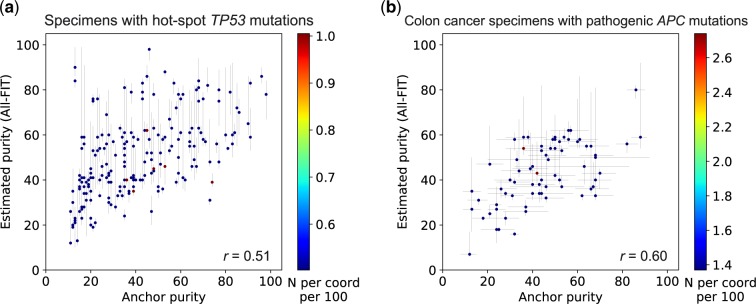
Fig. 8.
Relationship between estimated purity and allele frequency of anchor mutations. (a) All-FIT’s purity estimates corroborate with the observed VAFs of hot-spot TP53 mutations detected in 199 solid tumor specimens, which are expected to be under copy-neutral LOH and indicative of the tumor content (r = 0.51). (b) All-FIT’s purity estimates corroborate with VAFs of pathogenic APC mutations detected in 73 colon cancer specimens (r = 0.60). The horizontal lines at each point represent the expected tumor content based on LOH and copy-neutral LOH models for single APC mutation or based on heterozygous model for two APC mutations. The scale-bar represents the number of overlapping specimens at each coordinate per 100

