
Figure 12.
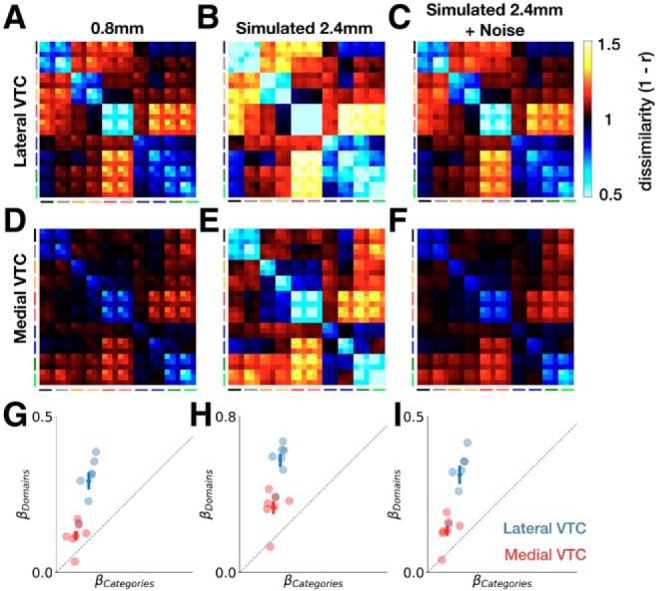
Effects of spatial resolution on representational structure. Group-averaged RDM for lateral VTC at (A) 0.8 mm, (B) simulated 2.4 mm, and (C) simulated 2.4 mm with added Gaussian noise. D–F, Same as in A–C, but for medial VTC. Model RDM fits for domains and categories for lateral VTC (blue) and medial VTC (red) at (G) 0.8 mm, (H) simulated 2.4 mm, and (I) simulated 2.4 mm with added Gaussian noise. Crosses represent ±1 SEM across participants.