
Figure 2.
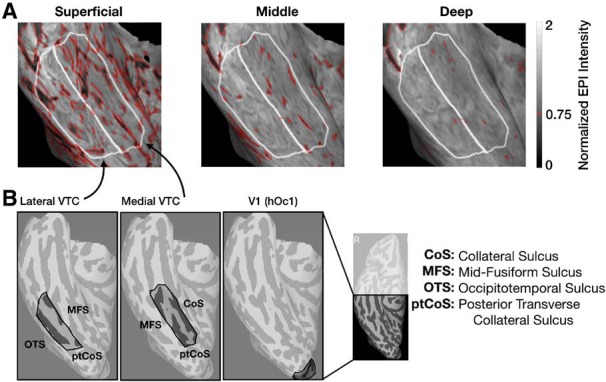
Visualization of likely veins and ROI definitions on the cortical surface of a representative participant's right-hemisphere VTC. A, Time-averaged normalized EPI intensities in a zoomed-in view of an example participants' right-hemisphere ventral temporal cortex (VTC) shown at each cortical depth. White lines indicate the boundaries of the lateral VTC and medial VTC ROIs for this participant. Red outlines indicate values < 0.75, designated as likely veins. The data at the corresponding surface locations were removed at all depths from subsequent analyses. B, Example ROI definitions in the right hemisphere of a representative participant for lateral VTC (left), medial VTC (middle), and V1 (right). Far right inset, The posterior region of the right hemisphere to which data acquisition was restricted.