Figure 4.
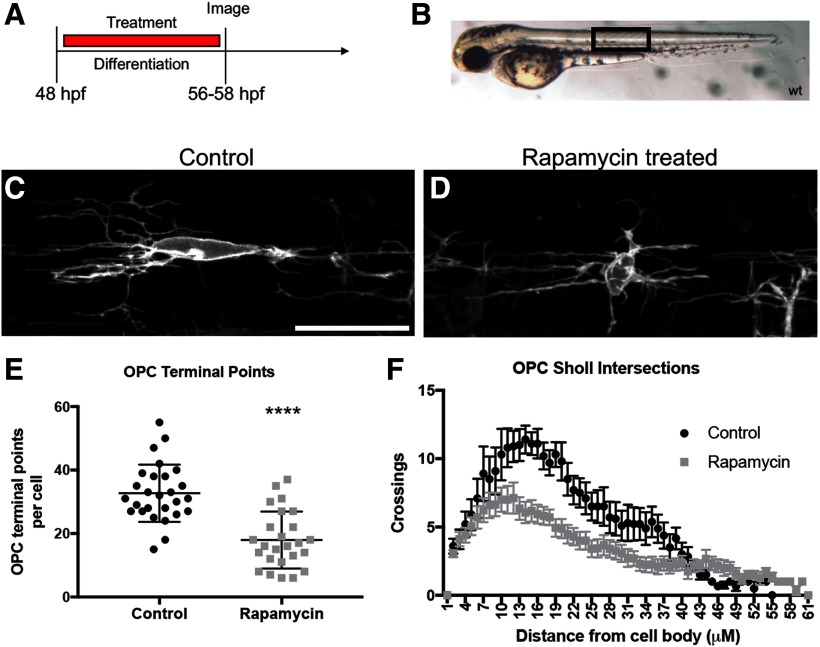
mTOR inhibition decreases OPC morphologic complexity in zebrafish embryos. A, Individual OPCs were analyzed in Tg(nkx2.2α:mEGFP) zebrafish embryos treated with vehicle control or with 5 μm rapamycin from 48 to 56 hpf. B, Zebrafish were placed in live imaging media and mounted in low-melt agarose. All images are a lateral view taken above the yolk sac extension (black box). C, D, Control or rapamycin-treated cells displayed different morphologic complexities. Scale bar, 25 µm. E, F, Individual cells were analyzed using IMARIS software to quantify the number of OPC terminal points (E), a representation of the number of OPC branches, ****p < 0.0001, error bars are SD, or the number of Sholl intersections (F), error bars are SEM. Area under curve (arbitrary units): Control 298.2 ± 16.49, Rapamycin 200.8 ± 12.48, p = 0.0011.

