Figure 6.
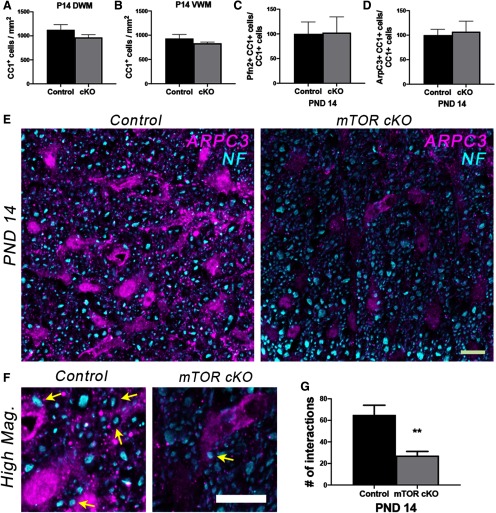
Recovery in the number of morphologically differentiated cells but decreased ARPC3/NF interaction in mTOR cKO at P14 in vivo. A, B, Quantification of the number of CC1+ cells in DWM (A) or VWM (B) at P14 in control versus mTOR cKO spinal cords; n = 3–9. C, D, Percentage of CC1+ cells expressing profilin2 (C) or ARPC3 (D) at P14 in control versus mTOR cKO spinal cords; n = 3. E, Representative confocal maximum intensity images showing that despite the recovery of the number of CC1+ cells expressing ARPC3 by P14, there was decreased interaction between ARPC3+ (magenta) soma or processes with NF+ (cyan) in mTOR cKO VWM spinal cords. F, Higher-magnification confocal images from representative images in E, with yellow arrows pointing to ARPC3 and NF interactions. Scale bars: E, F, 10 µm. G, Quantification of the number of interactions between ARPC3+ soma or processes and NF+ axons in control and mTOR cKO spinal cords at P14 (see Materials and Methods); n = 3-5. Control = 65.0 ± 9.03, mTOR cKO = 27.2 ± 3.94, **p = 0.004. All values are expressed mean as ± SEM.

