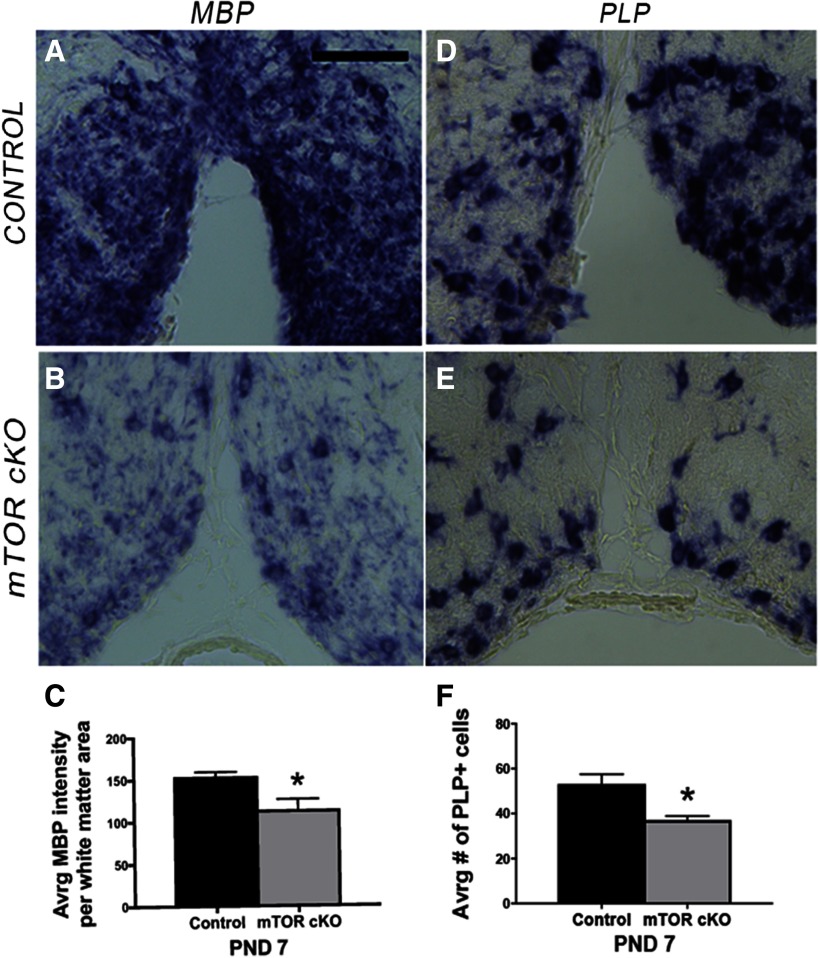
Figure 7.
Loss of mTOR in oligodendrocytes decreases Mbp, and Plp mRNA expression in developing spinal cord oligodendrocytes in vivo. A, B, Representative images of ISH for Mbp RNA in ventral spinal cord sections from control (A) or mTOR cKO (B) mice at P7. Scale bar, 100 µm. C, Quantification of Mbp RNA expression in spinal cord white matter; WT, n = 3; cKO, n = 4. *p = 0.004. Error bars are SD. D, E, Representative images of ISH for Plp RNA in ventral spinal cord sections from control (D) or mTOR cKO (E) mice at P7. F, Quantification of number of Plp-positive cells in spinal cord white matter; WT, n = 3; mTOR cKO, n = 4. *p = 0.002. Error bars are SD.

