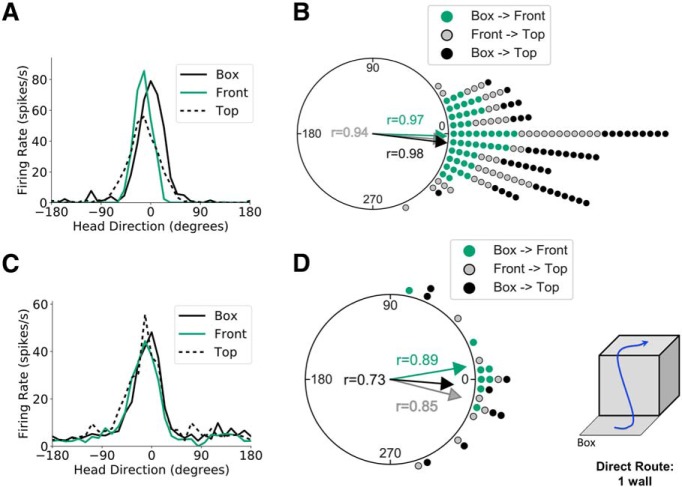
Figure 3.
One-wall sessions. A, Head direction tuning curves for a representative HD cell recorded during a one-wall session (front wall) in light conditions. Head direction is measured relative to the cell's PFD in the start box. B, A polar dot plot showing PFD shifts between relevant planes of locomotion for all one-wall sessions recorded in light conditions. Each dot represents one recording session. C, D, Same as A and B but for recording sessions in darkness. For clarity, the box depicted in the schematic of the apparatus is shown without walls and not elevated here and in Figures 4 and 5.

