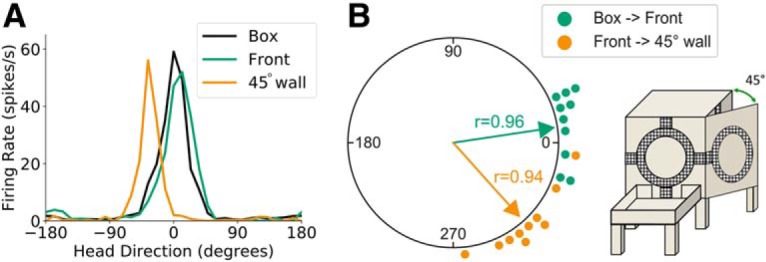
Figure 8.

Open wall sessions (45°). A, Head direction tuning curves for a representative HD cell recorded during an open wall session in light conditions. Head direction is measured relative to the cell's PFD in the start box. B, A polar dot plot showing PFD shifts between relevant planes of locomotion for all open wall sessions recorded in light conditions. Each dot represents one recording session. Note that the cells' PFDs shifted ∼45° CW for rightward outside 45° vertical corners.
