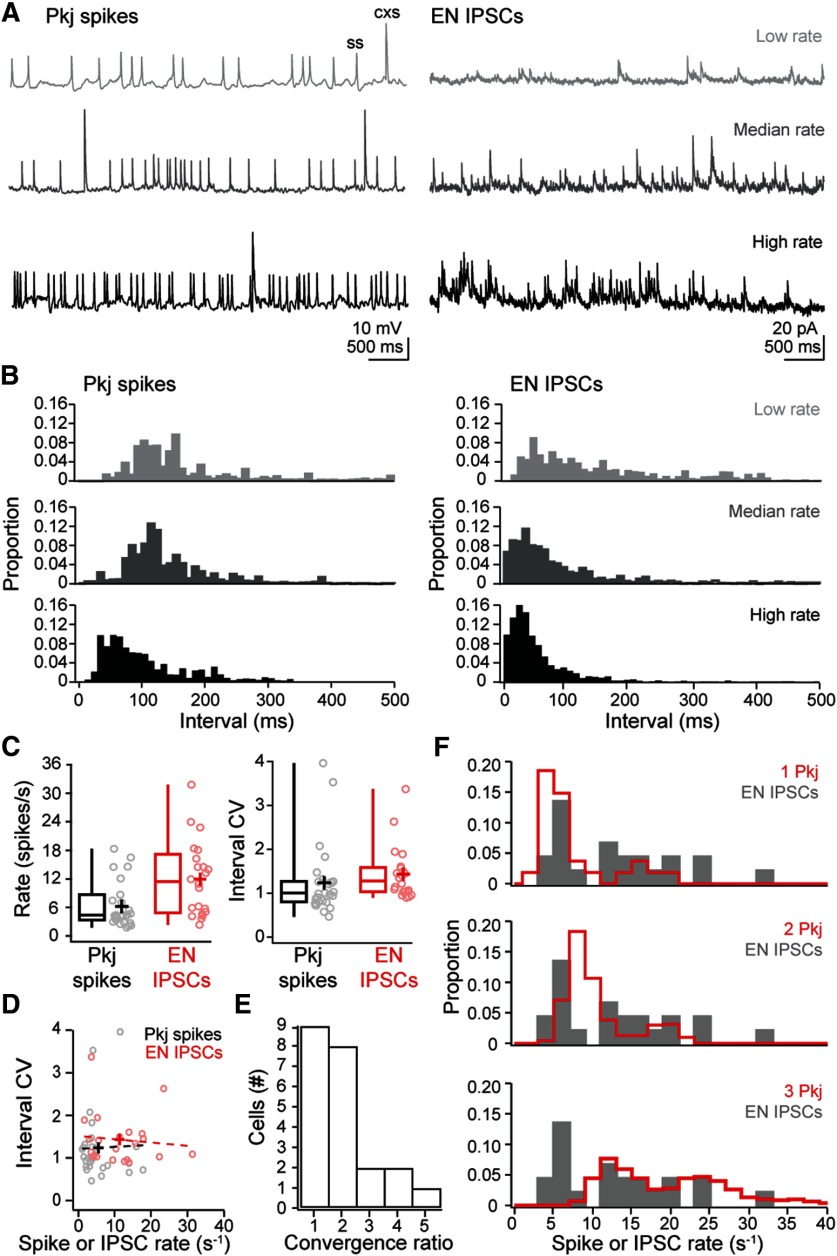
Figure 3.
Estimates of Purkinje cell convergence onto ENs. A, Example recordings of Purkinje cell (Pkj) spikes (left) and eurydendroid (EN) IPSCs (right), illustrating a low, median, and high rate (top, at the first quartile value; middle, median; bottom, third quartile value); ss, simple spike; cxs, complex spike. B, Histograms of interevent intervals for Purkinje spikes (left) and IPSCs (right) from the recordings in A. Bin width, 10 ms. C, Box-and-whisker plots of rate (left) and CV in the interevent interval (right) for Purkinje spikes (black) and eurydendroid IPSCs (red). Open circles represent data from individual cells. Crosses represent means. D, Interval CV versus rate of Purkinje spikes (black) or eurydendroid IPSCs (red) for each cell. Dashed lines indicate linear fits to each distribution. E, Histogram of the convergence ratios across cells estimated as the rounded ratio of IPSC rate to mean Purkinje cell spike rate. F, Probability histogram of measured IPSC rates (gray) with the predicted distribution from 1, 2, or 3 Purkinje cells superimposed (red).

