Figure 5.
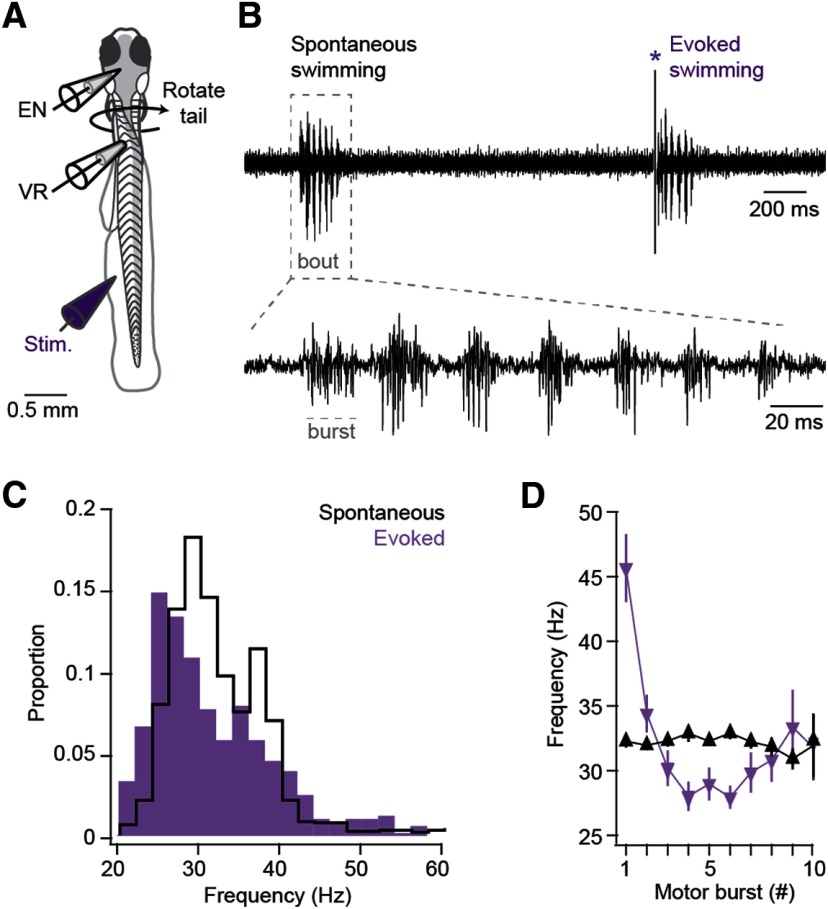
Comparison of ventral root (VR) activity during spontaneous and sensory-evoked fictive swimming. A, Diagram of preparation during simultaneous EN and VR recordings. B, Top, Example VR recording of bouts of spontaneous (left) and evoked (right) fictive swimming. *Stimulus artifact. Dashed box represents segment of trace expanded at bottom to illustrate bursts within the bout, as labeled. Dashed line indicates a motor burst. C, Probability histogram of burst frequency during evoked (purple) and spontaneous (black) swimming. Bin width, 1 Hz. D, Mean burst frequency for the first 10 bursts for bouts of evoked (purple) and spontaneous (black) swimming.

