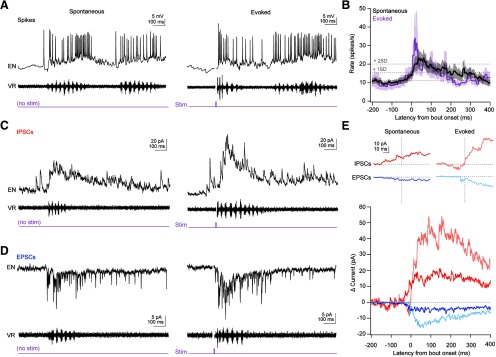
Figure 6.
Action potential firing and synaptic responses of ENs during spontaneous and sensory-evoked swimming. A, Example records of spikes from a single current-clamped EN (top), ventral root recording (middle), and time of 5 ms tactile stimulus to the tail (bottom), for spontaneous (left) and evoked (right) swimming. Stimulus artifact is blanked. B, Mean ± SEM instantaneous spike rate during spontaneous (black) and evoked (purple) swimming, digitized at 1 kHz. Dotted lines indicate mean basal firing rate plus 1 or 2 SDs. IPSCs (C) or EPSCs (D) from a single cell with ventral root recordings during spontaneous (left) and evoked (right) swimming. E, Top, High gain illustration of onset of responses shown below. Vertical dotted line indicates swimming onset. Horizontal dotted lines indicate zero current. All plots are on the same scale. Bottom, Mean inhibitory (red) and excitatory (blue) currents during evoked (light lines) and spontaneous (dark lines) swimming. Time zero indicates bout onset. Recordings were zeroed to the mean holding current 1 s before bout onset and averaged across all bouts for each cell.

