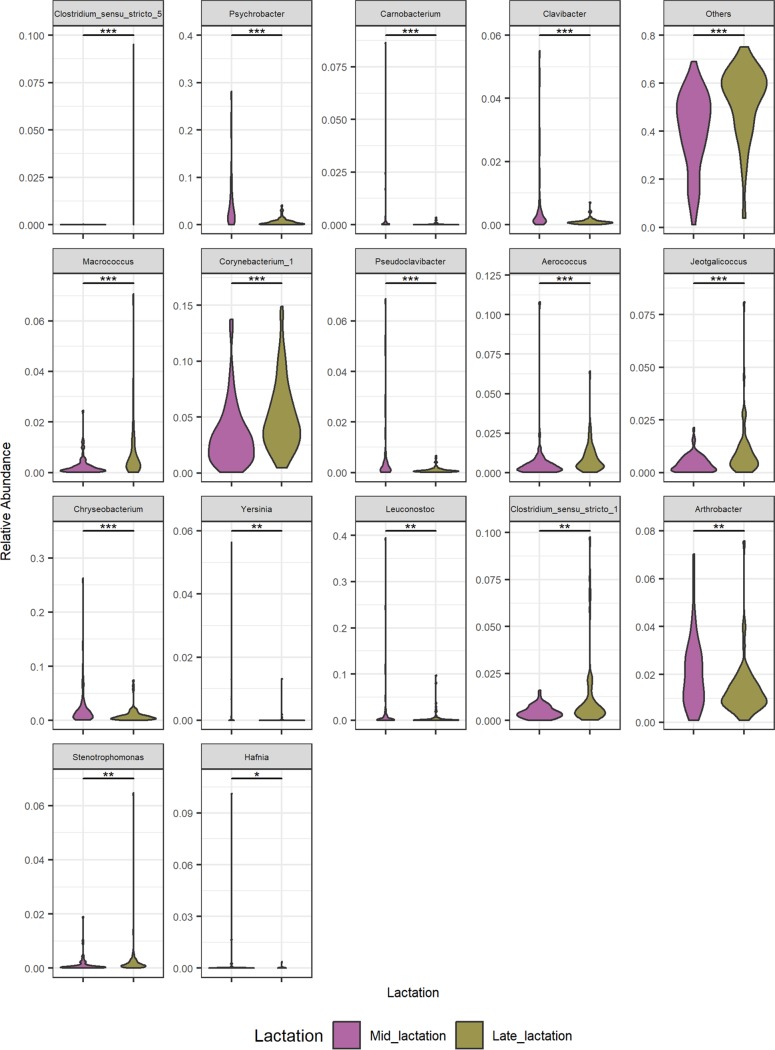
FIG 4.
Significantly differential relative abundances of taxa constituting at least a 5% relative abundance in at least one sample between mid- and late-lactation bulk tanks. Shown are violin plots of genera that differ significantly in relative abundances between mid- and late-lactation bulk tanks. This highlighted genera that are present at a >5% relative abundance in at least one sample. A pairwise Wilcoxon rank sum test using Benjamini-Hochberg P value correction/FDR correction analysis was performed, and samples are ordered by the lowest P value to the highest (***, P < 0.001; **, P < 0.01; *, P < 0.05).

