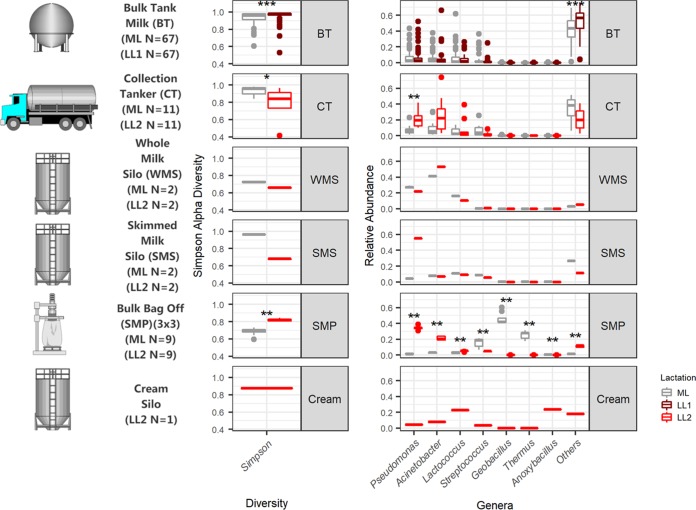
FIG 8.
Summary of differences in results due to sampling location and lactation stage. A brief sampling schematic with numbers, Simpson alpha diversity values, as well as genera with an average of at least a 10% relative abundance per sample location and lactation stage are shown, and significant differences are highlighted (***, P < 0.001; **, P < 0.01; *, P < 0.05).

