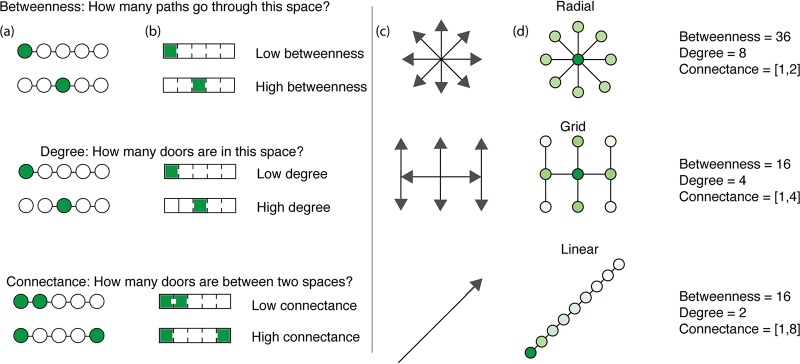
FIG 3.
Spatial connectivity, highlighting betweenness and connectance of common room and door configurations. (a) Circles and lines follow the classic network representation. (b) The rectangles follow the architectural translation of networks. Shaded areas correspond to a measure of betweenness (the number of shortest paths between all pairs of spaces that pass through a given space over the sum of all shortest paths between all pairs of spaces in the building), degree (the number of connections a space has to other spaces between any two spaces), and connectance (the number of doors between any two spaces). (c) The arrows represent possible directions of microbial spread as determined by the layout of the BE. (d) The circles represent the current knowledge of microbial spread based on microbial abundance through BEs as determined by layout. Darker colors represent higher microbial abundance, and lighter colors represent lower microbial abundance.

