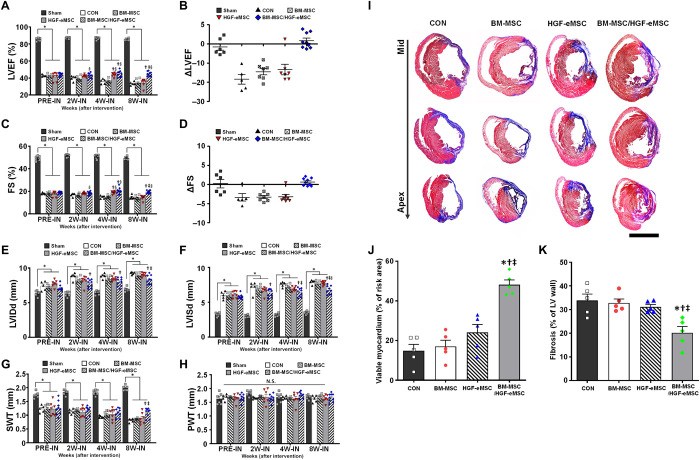
Fig. 4. Implantation of the BM-MSC/HGF-eMSC patch improved cardiac function and reduced adverse cardiac remodeling.
(A to B) LVEF and EF change at 8 weeks after intervention. CON, control. (C to D) FS and FS change at 8 weeks after intervention. (E) LVIDd. (F) LVISd. (G) SWT. (H) PWT. *P < 0.05 compared to sham group; †P < 0.05 compared to control group; ‡P < 0.05 compared to BM-MSC group; §P < 0.05 compared to HGF-eMSC group. n = 5 to 9 for each group. N.S., not significant. (I) Representative images from the four experimental groups showing cardiac fibrosis after staining with Masson’s trichrome in the hearts harvested 8 weeks after MI and (J) their quantification results such as percentage of viable myocardium and (K) percent fibrosis. *P < 0.05 compared to control group; †P < 0.05 compared to BM-MSC group; ‡P < 0.05 compared to HGF-eMSC group. n = 5 to 6 for each group. Scale bar, 5 mm.

