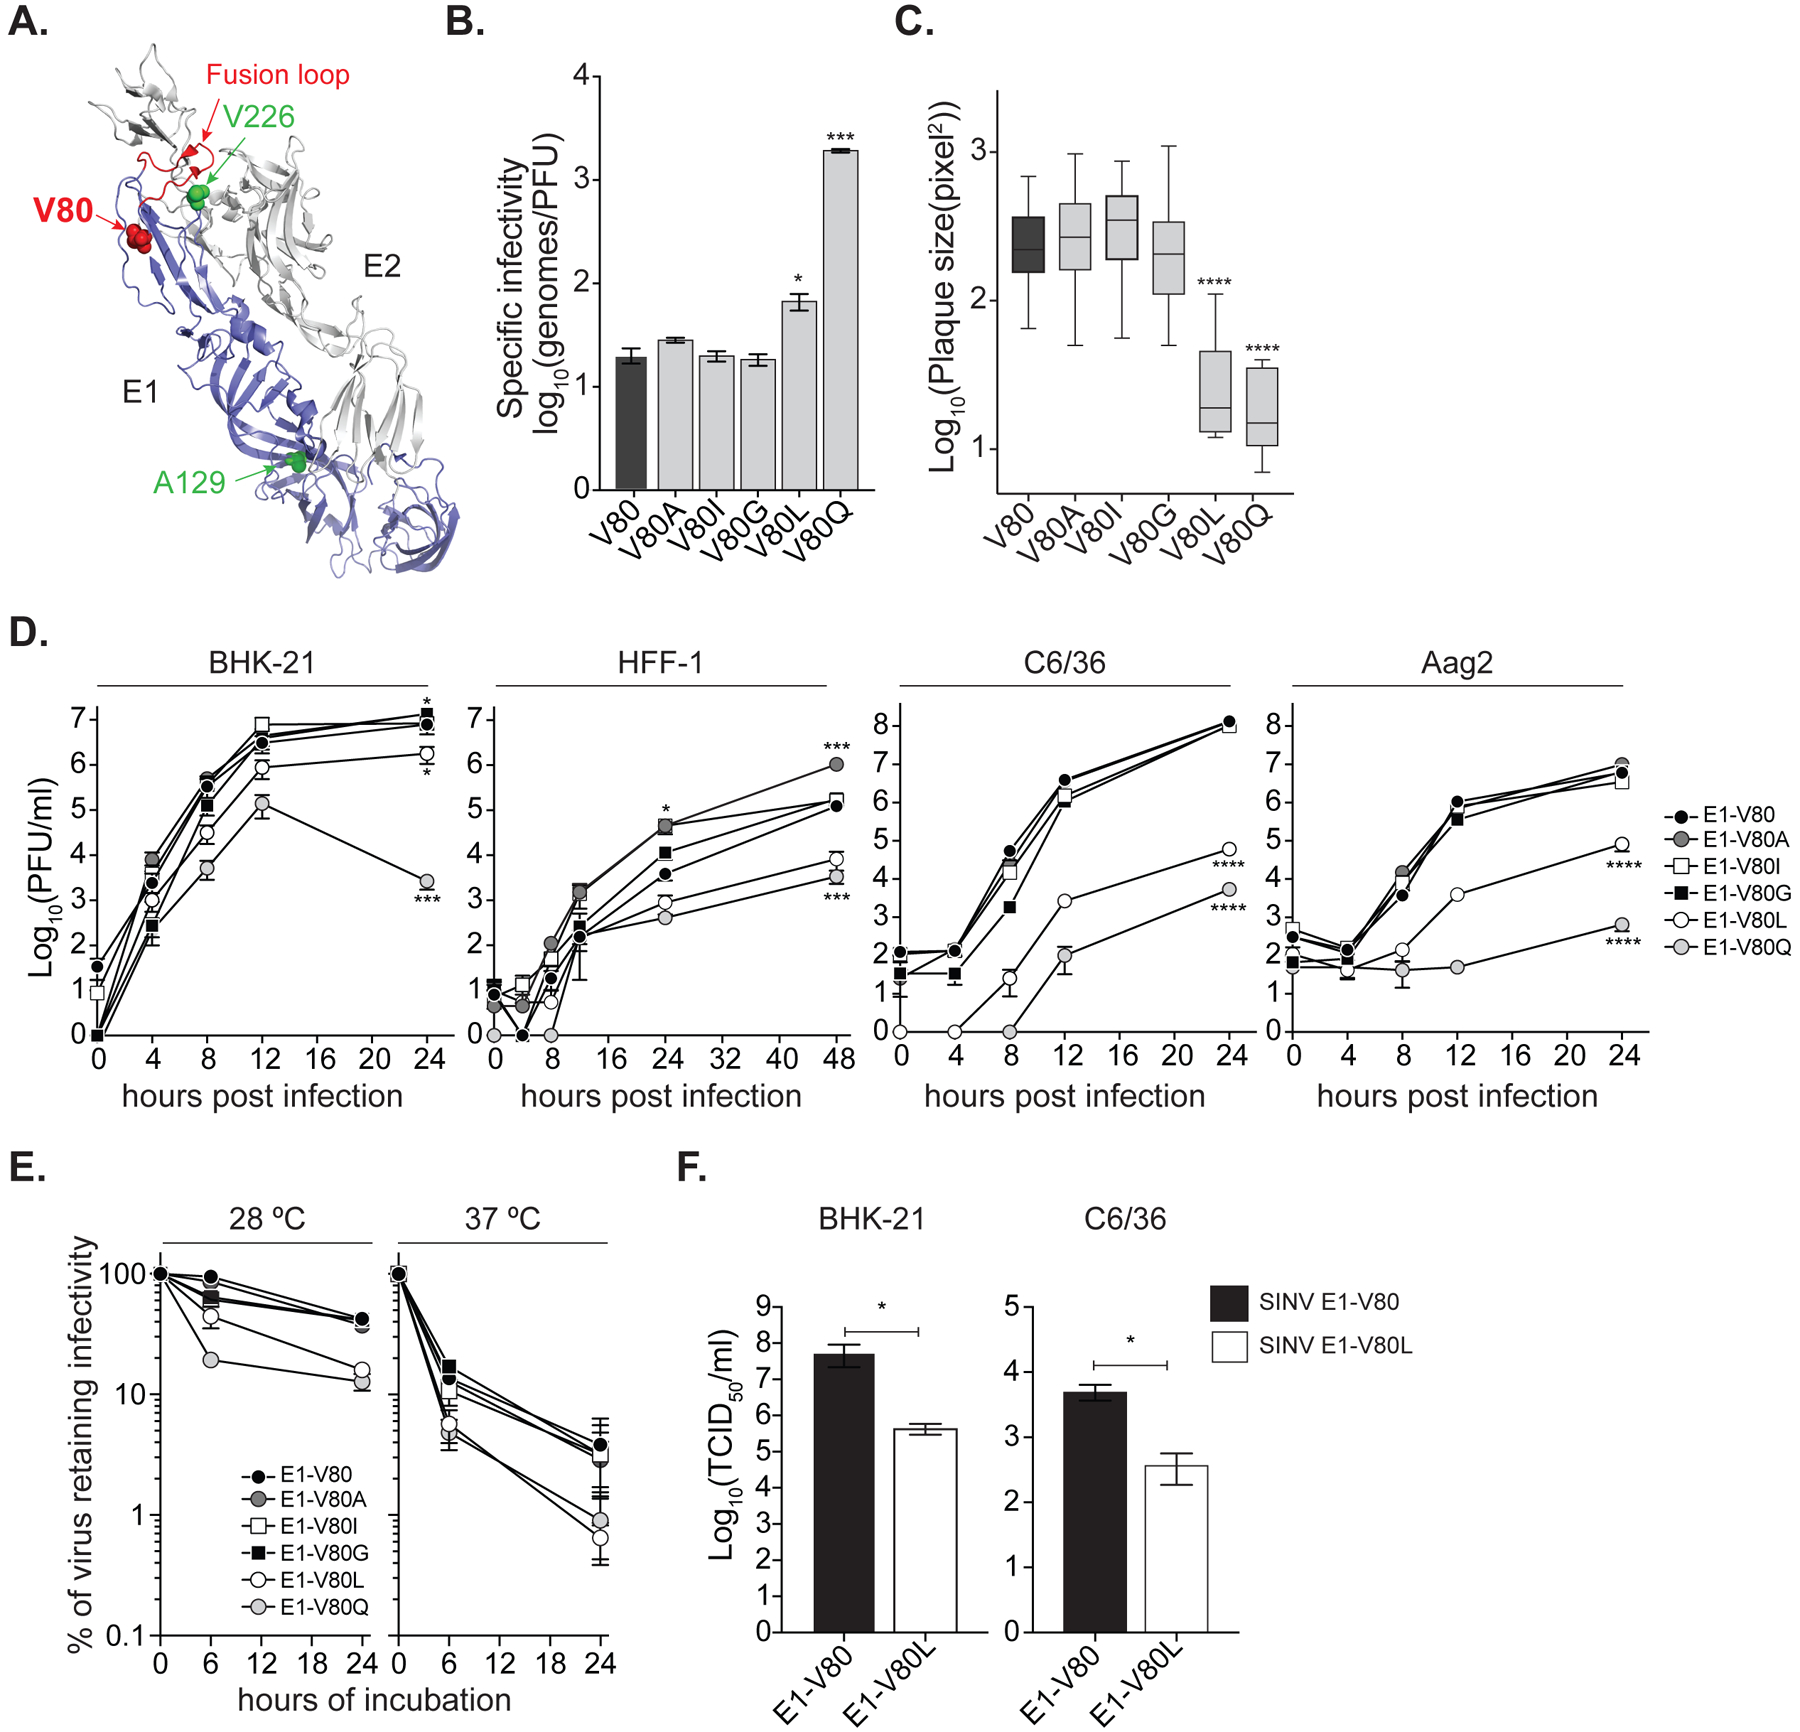
Figure 1. Position 80 of the E1 glycoprotein is a main determinant of alphavirus infectious particle production in vitro.

(A) Ribbon representation of the CHIKV E1/E2 heterodimer (PDBID: 3N42) highlighting the E1 monomer (blue) and the E2 monomer (gray). Residue at position 80 is shown as a red sphere. Positions E1–226 and E1–129 are highlighted in green. The E1-fusion loop is indicated in red. (B) Specific infectivity expressed as number of genomes over infectious particles (genomes/PFU). Data represent three independent repetitions, * p < 0.05, *** p < 0.001; Kruskal-Wallis test. (C) Plaque size in Vero cells, **** p < 0.0001, N > 40; Kruskal-Wallis test. (D) Multi-step viral replication curves performed in mammal BHK-21 and HFF-1, and mosquito C6/36 and Aag2 cell lines. Data represent two independent experiments, each with internal triplicates, * p<0.05, *** p<0.001 and **** p<0.0001. P values were determined by two-way ANOVA with Bonferroni post-hoc test. (E) Virion thermostability in cell-free environment. Data represent two independent experiments, 6 h at 28 °C: E1-V80Q, E1-V80L, E1-V80I and E1-V80G p< 0.0001; 24 h at 28 °C: E1-V80Q p<0.0001 and E1-V80L p<0.001; 6 h at 37 °C: E1-V80Q and E1-V80L p = 0.001. P values were determined by two-way ANOVA with Bonferroni post-hoc test. (F) Production of SINV infectious particles determined by TCID50. Data represent two independent experiments, each with internal duplicates, * p<0.05. P values were determined by Mann-Whitney U test. (B-F) The data represent the mean and the standard error of the mean (SEM). See also Figure S4 and S5.
