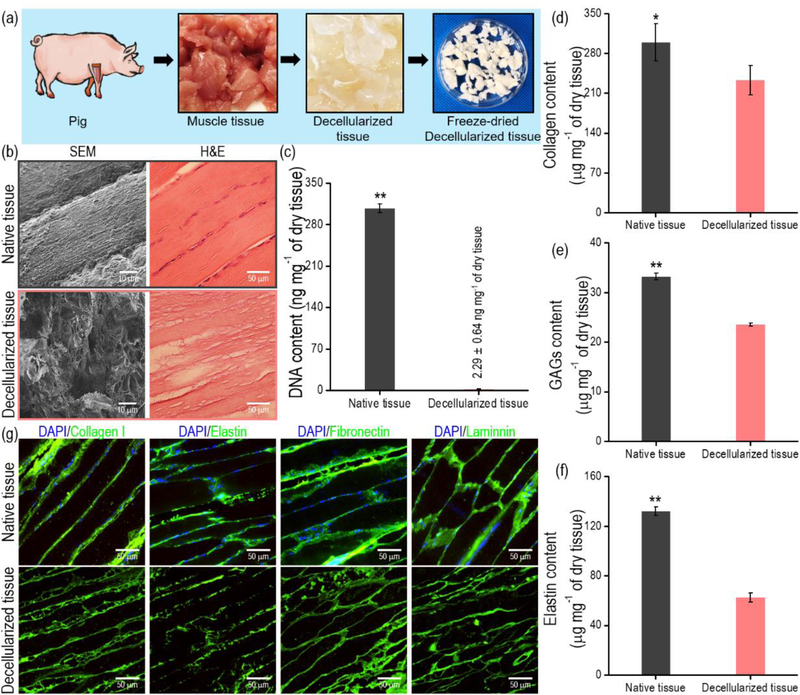
Figure 1.
(a) Schematic of the decellularization process using muscle tissue. (b) SEM and histomorphological images of native and decellularized muscle tissue. (c) DNA, (d) collagen, (e) GAG, and (f) elastin contents before and after decellularization (n = 5, *P < 0.05, **P < 0.01). (g) Immunofluorescence images of native and decellularized muscle tissue.

