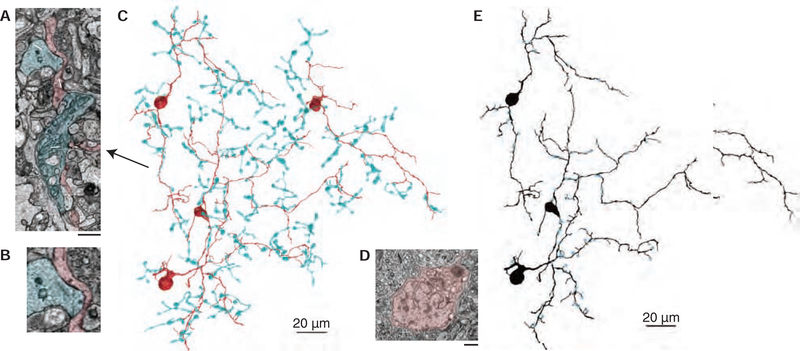
Figure 2. Identification of an S-cone exclusive amacrine cell.
(A) Electron micrographs of three ribbon synapses (white arrows) from an S-ON bipolar cell (cyan) to an S-cone amacrine cell (red). Scale bar is 1.5 μm. (B) Inset from 2A showing two S-ON bipolar cell ribbon synapses. (C) 3D reconstructions of S-ON bipolar cell axon terminals providing input to four S-cone amacrine cells (red). (D) S-cone amacrine cells are easily identifiable by their asymmetric nuclei offset from the center of their soma. Scale bar is 1 μm. (E) Locations of S-ON bipolar cell input (blue) to three S-cone amacrine cells.

