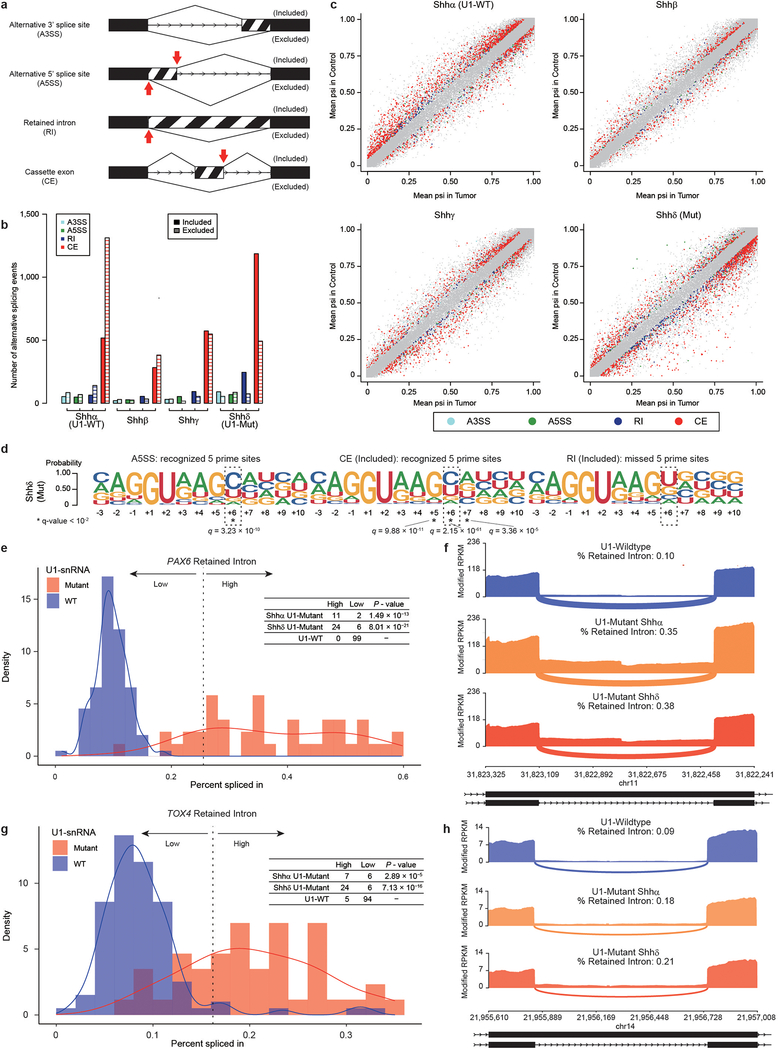
Extended Data Fig. 8. – Retained introns inactivate tumor suppressor genes in U1-snRNA(r.3a>g) mutant tumors.
a) Illustration of the different types of alternative splicing events analyzed by rMATS (n = 30 each subtype). Red arrows indicate expected 5′ prime sites recognized by the mutant U1-snRNA.
b) Quantitation of alternative splicing events by Shh subtype, as detected by exon-centric alternative splicing analysis.
c) Scatter plots of alternative splicing events (n = 30 each subtype). X axis shows the difference of PSI (percent spliced in) calculated by rMATS. Different types of significant events (FDR < 0.01 and absolute differential PSI > 0.05 calculated by rMATS see Methods) are illustrated by different colors as annotated.
d) Splice site sequences of alternative five prime splice site, included cassette exon (CE) and included retained intron (RI) events in U1-snRNA mutant Shhδ (n = 30). Each event corresponds to a red arrow cartoon in ‘a’. Asterisk denotes nucleotide sites with q-value < 10−2 (Chi-Squared Test and BH Method).
e) Distribution of percent spliced in for PAX6 based on U1-snRNA mutation status (n = 13 for Shhα U1-mutant, n = 30 for Shhδ U1-mutant, n = 99 for U1-wildtype Shh (n = 90) and normal brain tissue (n = 9)). Dashed line defines threshold that divides the dataset into two groups (k-means method). Table displays number of samples above the threshold (high) or below (low) based on mutational status. P-value is calculated using two-sided Fisher’s exact test compared to U1-wildtype samples. U1-snRNA Mutant samples are indicated in pink, and wildtype samples in blue.
f) Sashimi-plot of splicing of PAX6 based on mutational status determined by exon-centric alternative splicing analysis (rMATS). The bar plot shows modified fragments per kilobase per millions mapped (mFPKM). Numbers enumerate average junctional reads across all samples. Annotated exon tracks are shown below with genomic positions marked.
g) Distribution of percent spliced in for TOX4 based on U1-snRNA mutation status status (n = 13 for U1-mutant Shhα, n = 30 for U1-mutant Shhδ, n = 99 for U1-wildtype Shh (n = 90) and normal brain tissue (n = 9)). Dashed line defines threshold that divides the dataset into two groups (k-means method). Table displays number of samples above the threshold (high) or below (low) based on mutational status. P-value is calculated using two-sided Fisher’s exact test compared to U1-wildtype samples. U1-snRNA mutant samples are indicated in pink, and wildtype samples in blue.
h) Sashimi-plot of splicing of TOX4 based on mutational status determined by exon-centric alternative splicing analysis (rMATS). The bar plot shows modified fragments per kilobase per millions mapped (mFPKM). Numbers enumerate average junctional reads across all samples. Annotated exon tracks are shown below with genomic positions marked.

