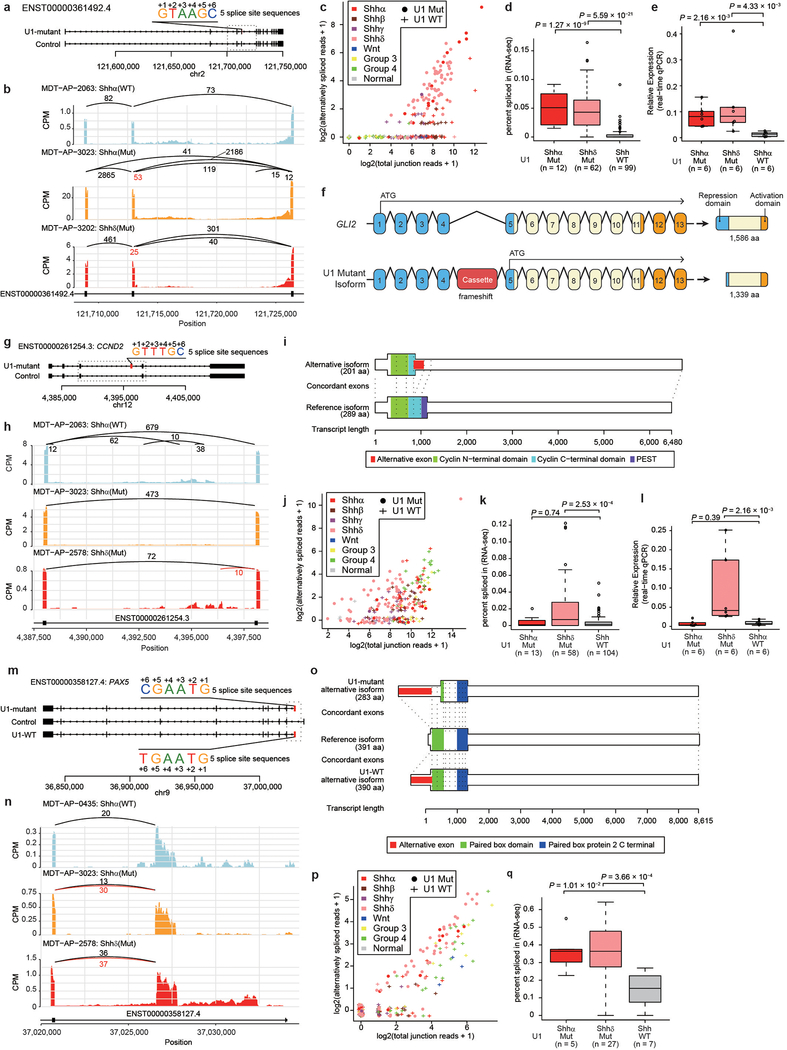
Extended Data Fig. 10. – Aberrant splicing of oncogenes and tumor suppressor genes in U1- mutant Shh-MB.
a) Overview of cryptic alternative splicing of GLI2 demonstrating the position of a cryptic cassette exon with the 5′ splice site sequence.
b) Sashimi-plot of splicing of GLI2 in representative cases. The bar plot shows counts per million reads. Numbers enumerate junctional reads, with U1-mutant isoform reads in red.
c) Scatter plot comparing detected alternatively spliced read and total junction reads which shared 3 prime splice site. Jittering was performed for both values.
d) ‘Percent spliced in’ values by U1-mutant Shhα, U1-mutant Shhδ, and U1-wildtype Shh (all Shh subtypes). Boxplot center lines show data median; box limits indicate the IQR from the 25th and 75th percentiles; lower and upper whiskers extend 1.5 times the IQR. Outliers are represented by individual points. P-values were calculated using two-sided Wilcoxon-rank sum test.
e) Boxplot of fold changes in expression of the alternatively spliced isoform as compared to the wildtype isoform of GLI2 in subsets of Shh-MB as determined by real-time qPCR. Boxplot center lines show data median; box limits indicate the IQR from the 25th and 75th percentiles; lower and upper whiskers extend 1.5 times the IQR. Outliers are represented by individual points. P-values were calculated using two-sided Wilcoxon-rank sum test.
f) Illustration of canonical and cryptic isoform of GLI2. Translation start sites are indicated with an ATG arrow. Resulting proteins (and size) are displayed for each isoform. Repression and activation domains are indicated in blue and orange respectively. aa denotes amino acids.
g) Overview of cryptic alternative splicing of CCND2 illustrating the position of a cryptic cassette exon with the 5′ splice site sequence.
h) Sashimi-plot of representative cases demonstrates alternative splicing at the CCND2 locus. Numbers illustrate junctional reads. Junctional reads specific to U1-mutants are in red.
i) The canonical isoform and the cryptic isoform of CCND2.
j) Scatter plot comparing detected alternatively spliced read and total junction reads which shared 3 prime splice. Jittering was performed for both values.
k) ‘Percent spliced in’ values by U1-mutant Shhα (n = 13), U1-mutant Shhδ (n = 58), and U1-wildtype Shh (all Shh subtypes, n = 104). Boxplot center lines show data median; box limits indicate the IQR from the 25th and 75th percentiles; lower and upper whiskers extend 1.5 times the IQR. Outliers are represented by individual points. P-values were calculated using two-sided Wilcoxon-rank sum test.
l) Real-time qPCR comparing the expression of the cryptic isoform of CCND2 demonstrates high levels of expression of CCND2 restricted to Shhδ cases (n = 6 for U1-mutant Shhα, n = 6 for U1-mutant Shhδ, n = 6 for U1-wildtype Shhα). Boxplot center lines show data median; box limits indicate the IQR from the 25th and 75th percentiles; lower and upper whiskers extend 1.5 times the IQR. Outliers are represented by individual points. P-values were calculated using two-sided Wilcoxon-rank sum test.
m) Overview of cryptic alternative splicing of PAX5 illustrating the position of a cryptic cassette exon with the 5′ splice site sequence.
n) Sashimi-plot of representative cases demonstrates alternative splicing at the PAX5 locus. Numbers illustrate junctional reads. Junctional reads specific to U1-mutants are in red.
o) The canonical isoform and the cryptic isoform of PAX5.
p) Scatter plot comparing detected alternatively spliced read and total junction reads which shared 3 prime splice site. Jittering was performed for both values.
q) ‘Percent spliced in’ values by U1-mutant Shhα (n = 5), U1-mutant Shhδ (n = 27), and U1-wildtype Shh (all Shh subtypes, n = 7). Boxplot center lines show data median; box limits indicate the IQR from the 25th and 75th percentiles; lower and upper whiskers extend 1.5 times the IQR. Outliers are represented by individual points. P-values were calculated using two-sided Wilcoxon-rank sum test.

