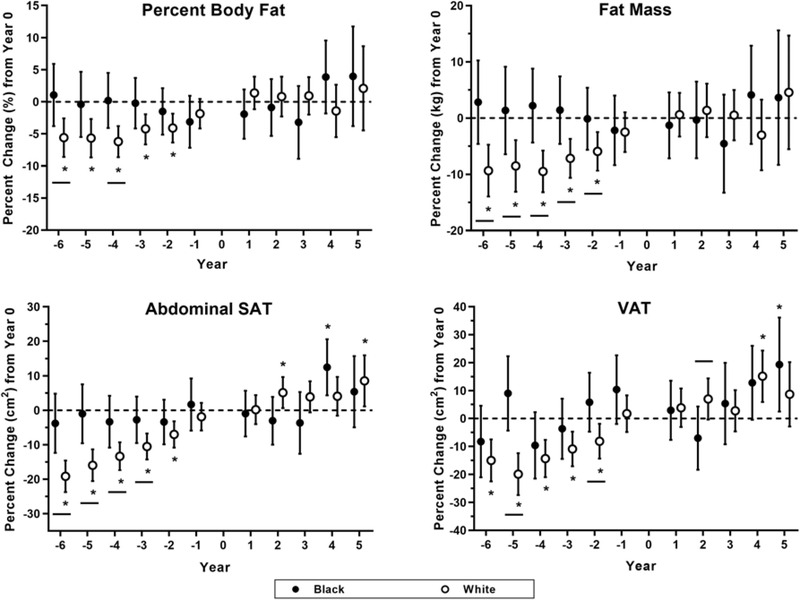
Figure 1. Percent Change in Body Composition & Adipose Tissue Distribution.
Percent change in percent body fat (%), fat mass (kg), abdominal subcutaneous adipose tissue (SAT; cm2), and visceral adipose tissue (VAT; cm2) are displayed across the menopause transition in years. Menopause onset is denoted as Year 0, with negative years implying years before menopause onset and positive years implying years after menopause onset. Data are displayed as means with 95% confidence intervals for each race. Closed circles (•) indicate data from Black women, and open circles (○) indicate data from White women.

