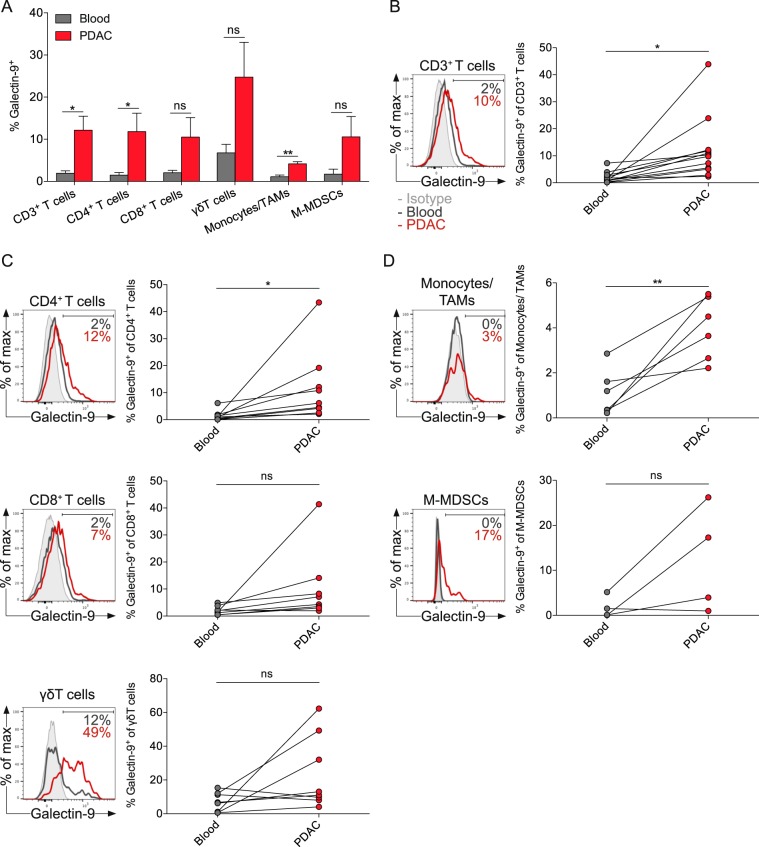
Fig. 3. PDAC-infiltrating immune cells express higher levels of galectin-9 compared with matched blood immune cells.
a Percentages of galectin-9 expression of indicated immune cells in matched blood and tumor specimens from PDAC patients. b Histogram and quantification of galectin-9 expression on all CD3+ T cells, c CD4+ T cells (CD3+CD4+CD8−, top), CD8+ T cells (CD3+CD4−CD8+, middle), γδ T cells (CD3+CD4−CD8−γδTCR+, bottom), d Monocytes/tumor-associated macrophages (TAMs, Lin−CD11b+CD14+, top) and monocytic myeloid-derived suppressor cells (M-MDSCs, Lin−CD11b+HLA-DR−CD14+, bottom). Each point represents data from one patient. Data, paired t-test. *p < 0.05, **p < 0.01.

