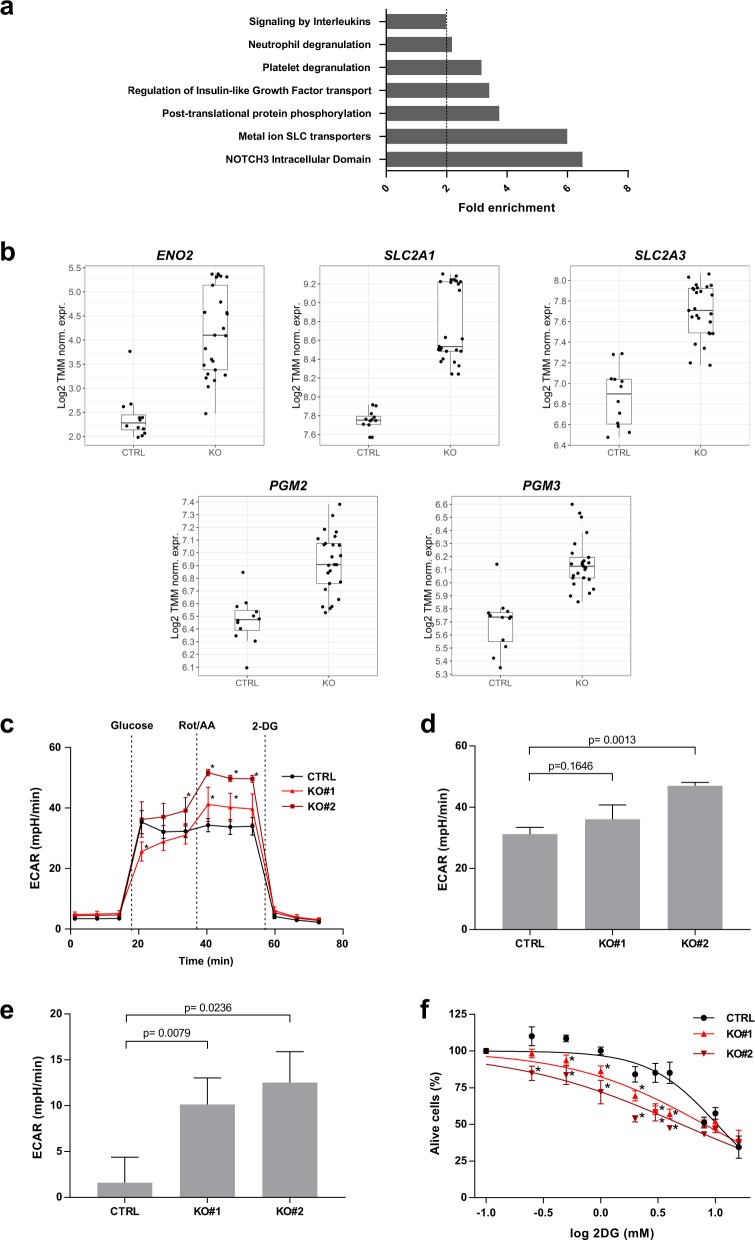
Fig. 3. Loss of ZBTB7A sensitizes to glycolysis inhibition.
K562 ZBTB7A KO and control cells underwent transcriptional profiling, metabolic flux analysis, and 2DG treatment. a Gene set enrichment analysis from RNA-Seq data. b Expression of ENO2 (Enolase), SLC2A1, and SLC2A3 (glucose membrane transporters), PGM2 and PGM3 (phosphoglycerate mutases) measured by RNA-Seq. c ECAR following the addition of glucose, Rot/AA, and 2DG. d Glycolytic capacity calculated as the ECAR after electron transport chain inhibition. e Glycolytic reserve calculated as the difference between glycolysis after glucose infusion and glycolytic capacity (F) cell viability after 2DG treatment. *p value < 0.05 compared with control cells.

