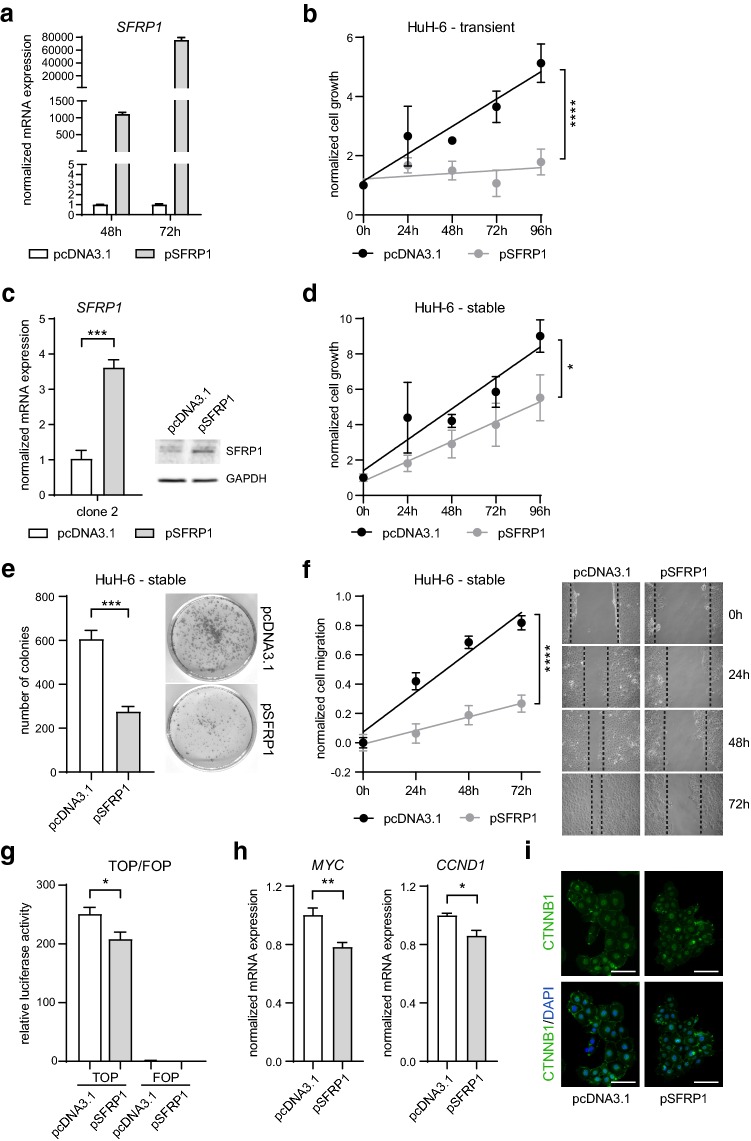
Fig. 2.
Restored SFRP1 expression affects WNT signaling activity and HB tumor cell characteristics. a mRNA expression of SFRP1 in transient pcDNA3.1- and pSFRP1-transfected HuH-6 cells after 48 and 72 h was determined by qRT-PCR and calculated as normalized mRNA expression (fold change) to pcDNA3.1 control (n = 2). b Cell growth of transient pcDNA3.1- and pSFRP1-transfected HuH-6 cells was assessed by MTT assay at indicated time points. Values were normalized to zero hour time point and shown as mean ± SEM (n = 2). Slope difference was analyzed by linear regression, ****p < 0.0001. c mRNA expression and representative immunoblot image of SFRP1 in stable pcDNA3.1- and pSFRP1-transfected HuH-6 cell clone 2. GAPDH served as loading control in immunoblot analysis (n = 2). Gene expression was determined by qRT-PCR and calculated as normalized mRNA expression (fold change) to pcDNA3.1 control (n = 3). d Cell growth of stable pcDNA3.1- and pSFRP1-transfected HuH-6 cells was assessed by MTT assay at indicated time points. Values were normalized to zero hour time point and shown as mean ± SEM (n = 4). Slope difference was analyzed by linear regression, *p < 0.05. e Representative pictures and quantification of number of colonies per well of stable pcDNA3.1- and pSFRP1-transfected HuH-6 cells (n = 3). f Representative pictures and quantification of cell migration at indicated time points were normalized to zero hour time points. Slope difference was analyzed by linear regression, ****p < 0.0001. g TOP/FOP reporter plasmid activity was assessed by a relative luciferase activity in stable pcDNA3.1- and pSFRP1-transfected HuH-6 cells 48 h after co-transfection (n = 5). h mRNA expression of MYC and CCND1 in stable pcDNA3.1- and pSFRP1-transfected HuH-6 cell clone 2 was determined by qRT-PCR and calculated as normalized mRNA expression (fold change) to pcDNA3.1 control (n = 4). i Immunofluorescence staining of β-catenin (CTNNB1, green) and DAPI nuclear staining (blue) in stable pcDNA3.1- and pSFRP1-transfected HuH-6 cells. Scale bars: 100 µm. All data are represented as mean ± SEM; unless otherwise stated p values were calculated by two-tailed, unpaired Student’s t test; *p < 0.05, **p < 0.01, ***p < 0.001, ****p < 0.0001

