Fig. 3.
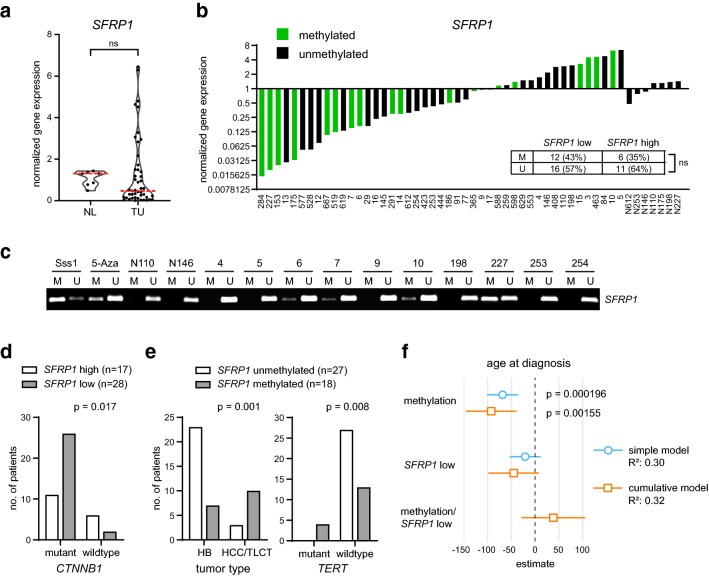
SFRP1 DNA methylation correlates with the tumor type and late onset of the disease. a mRNA expression of SFRP1 in normal liver (NL) and patient tumor samples (TU) was determined by qRT-PCR and calculated as normalized mRNA expression (fold change) to NL controls. The red line marks the median expression level. b For each tumor and normal tissue (N—number) sample, the normalized SFRP1 gene expression and promoter methylation status is shown. The embedded table displays the distribution of methylated (M) and unmethylated (U) SFRP1 in the SFRP1 low and high gene expression categories. c Representative pictures of the SFRP1 MSP reaction from selected normal and tumor tissue samples. Sss1-treated DNA serves as methylated positive control, 5-aza-treated DNA as unmethylated control. d Illustration of the correlation analysis of SFRP1 gene expression and β-catenin mutation status, see also Table 1. e Illustration of the correlation analysis of SFRP1 DNA methylation status to the tumor type, considering only HB and HCC/TLCT tumors, and to the TERT mutation status, see also Table 2. f Forest plot with a simple and cumulative generalized linear regression model considering SFRP1 methylation status, gene expression category and a combined profile in respect to the age at diagnosis

