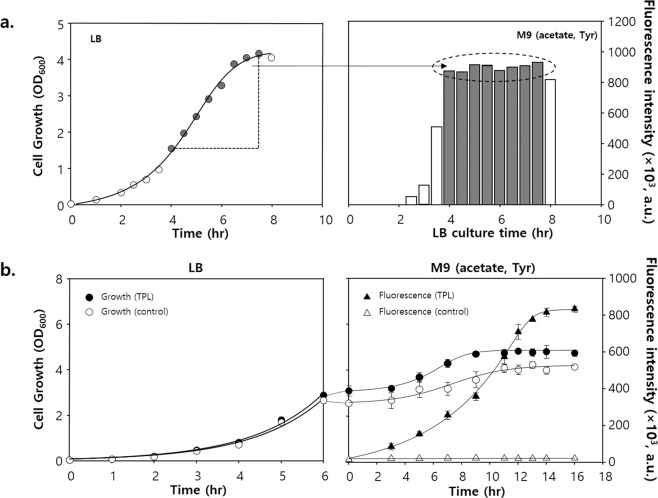
Figure 5.
Cell growth and fluorescence intensity of GESS expressing TPL determined with a two-step reaction. (a) Fluorescence intensity of GESS in response to TPL activity at different cell states in LB broth. (b) Time-lapse cell growth and fluorescence intensity by the two-step reaction. The cells were cultured in LB broth until the late exponential growth phase as the first step, and the detection reaction was performed in M9 acetate medium with tyrosine as the second step. Circles represent the OD600 value, and triangles represent the specific fluorescence intensity (GFP/OD600).

