Figure 4.
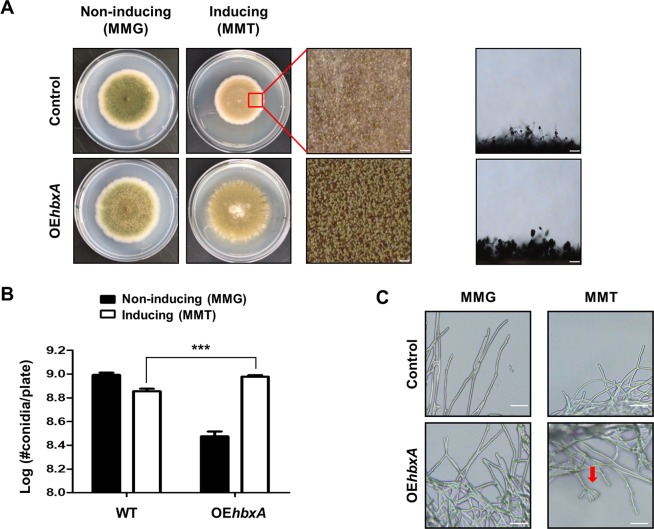
Effect of hbxA overexpression. (A) Control (TNJ36) and hbxA–overexpression (TYE19) strains were inoculated onto non-inducing (MMG) or inducing (MMT) condition media and photographed after 5 days of culture. The middle panels show the magnified views of the middles of the plates under the inducing conditions (bar = 0.25 µm). The panels on the right show the morphologies of the control (TNJ36) and OEhbxA (TYE19) conidiophores under the inducing conditions (bar = 0.25 µm). (B) Quantification of the number of conidia in the control (TNJ36) and OEhbxA (TYE19) strains shown in (A). Differences between the control and mutants, ***p < 0.001. (C) Photomicrographs of the mycelia in the control (TNJ36) and OEhbxA (TYE19) strains grown in liquid MMG (non-inducing) or MMT (inducing) media. Arrow indicates conidiospore.

