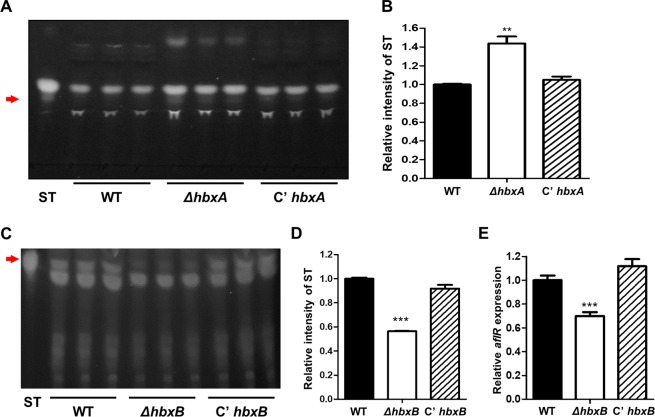
Figure 8.
Analysis of ST production in the ΔhbxA and ΔhbxB mutant. (A) Thin-layer chromatography (TLC) of ST from WT (TNJ36), ΔhbxA (TYE14), and C’hbxA (TYE27) strains was performed for 7 days in the dark. Arrow indicates ST. (B) Densitometry of the ST bands from the TLC plates shown in (A). Differences between the WT and mutants, **p < 0.01. (C) Thin-layer chromatography (TLC) of ST from WT (TNJ36), ΔhbxB (TSH1), and C’hbxB (TSH7) strains was performed for 7 days in the dark. Arrow indicates ST. (D) The densitometry of the ST bands from the TLC plates shown in (C). Differences between the WT and mutants, ***p < 0.001. (E) Relative mRNA levels of aflR in WT (TNJ36), ΔhbxB (TSH1), and C’hbxB (TSH7) strains.

