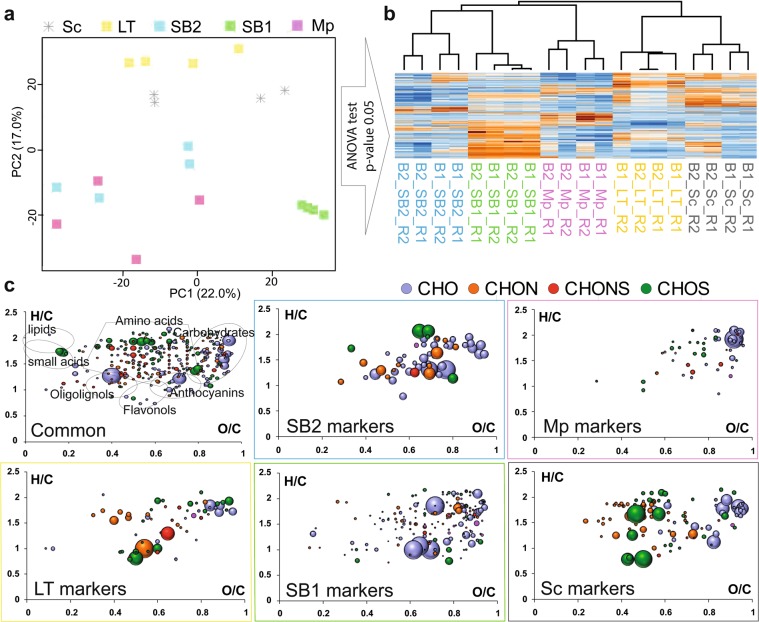
Figure 2.
(a) Principal component analysis of single yeast fermentations using direct methanol dilution. The first two components represent 39% of the variability. (b) ANOVA statistics and hierarchical cluster analysis were used to extract specific masses for each yeast strain. (c) Van Krevelen diagrams show elemental compositions common and specific to all analyzed yeast strains. Bubble sizes indicate relative intensities of corresponding peaks in the spectra. Color code: CHO, blue; CHOS, green; CHON, red; CHONS, orange.

