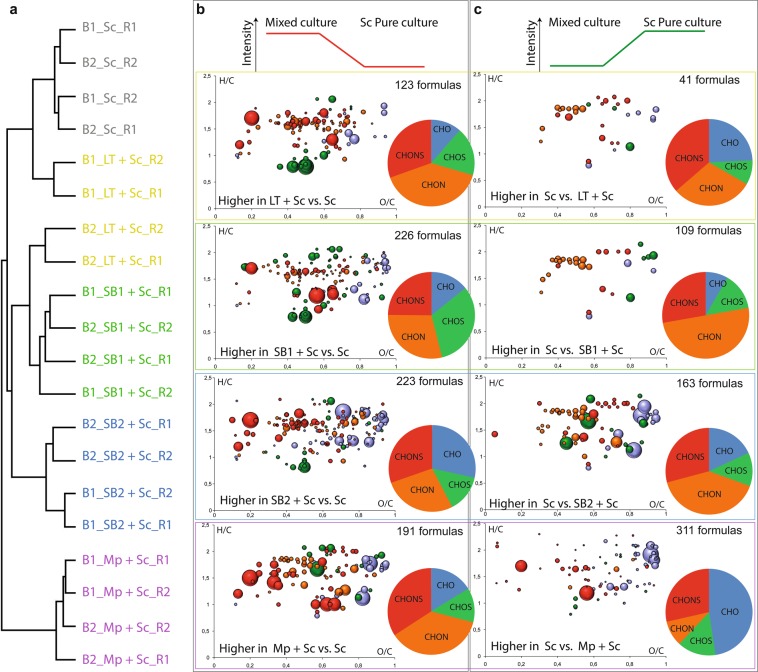
Figure 3.
(a) Hierarchical cluster analysis of Sc alone together with all sequential fermentated samples: LT + Sc, SB1 + Sc, SB2 + Sc and Mp+Sc. Van Krevelen diagrams and ratio of the compositional families specifically show detected compositions with significantly higher (b) and lower (c) peak intensities in each sequential fermented sample compared to the Sc pure culture. Bubble sizes indicate relative intensities of corresponding peaks in the spectra. Color code: CHO, blue; CHOS, green; CHON, red; CHONS, orange.

