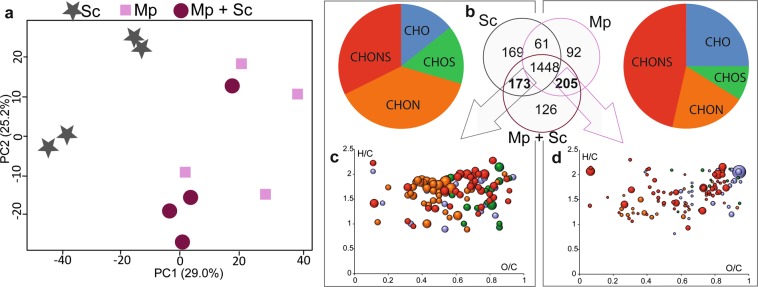
Figure 4.
(a) Principal component analysis of Sc and Mp single fermentations and Mp + Sc mixed fermentation with (b) Venn diagrams. Common markers of (c) Sc and Mp + Sc and (d) Mp and Mp + Sc are highlight in the van Krevelen diagrams and histograms representating the molecular formulas composition. Bubble sizes indicate relative intensities of corresponding peaks in the spectra. Color code: CHO, blue; CHOS, green; CHON, red; CHONS, orange.

