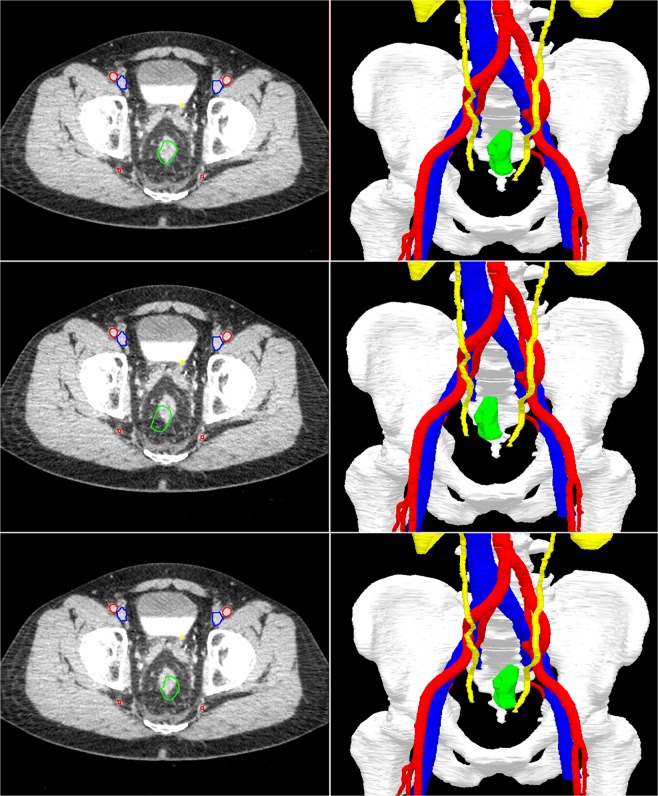
Fig. 3. An example to illustrate the real-time tumor tracking by the navigation system.
The top two images show the position of the rectal tumor in rest. In the lower four images, the rectum is moved to the right and left. Note that the green segmentation area follows the real-time tumor position in the navigation images on the right, while the CT scan on the left (still) shows the original position of the tumor. Visible segmentation: bones (white), arteries (red), veins (blue), ureters/kidneys (yellow), and tumor (green).

